Immigrants from Cameroon vs Portuguese Currently Married
COMPARE
Immigrants from Cameroon
Portuguese
Currently Married
Currently Married Comparison
Immigrants from Cameroon
Portuguese
44.2%
CURRENTLY MARRIED
0.3/ 100
METRIC RATING
249th/ 347
METRIC RANK
47.3%
CURRENTLY MARRIED
84.2/ 100
METRIC RATING
128th/ 347
METRIC RANK
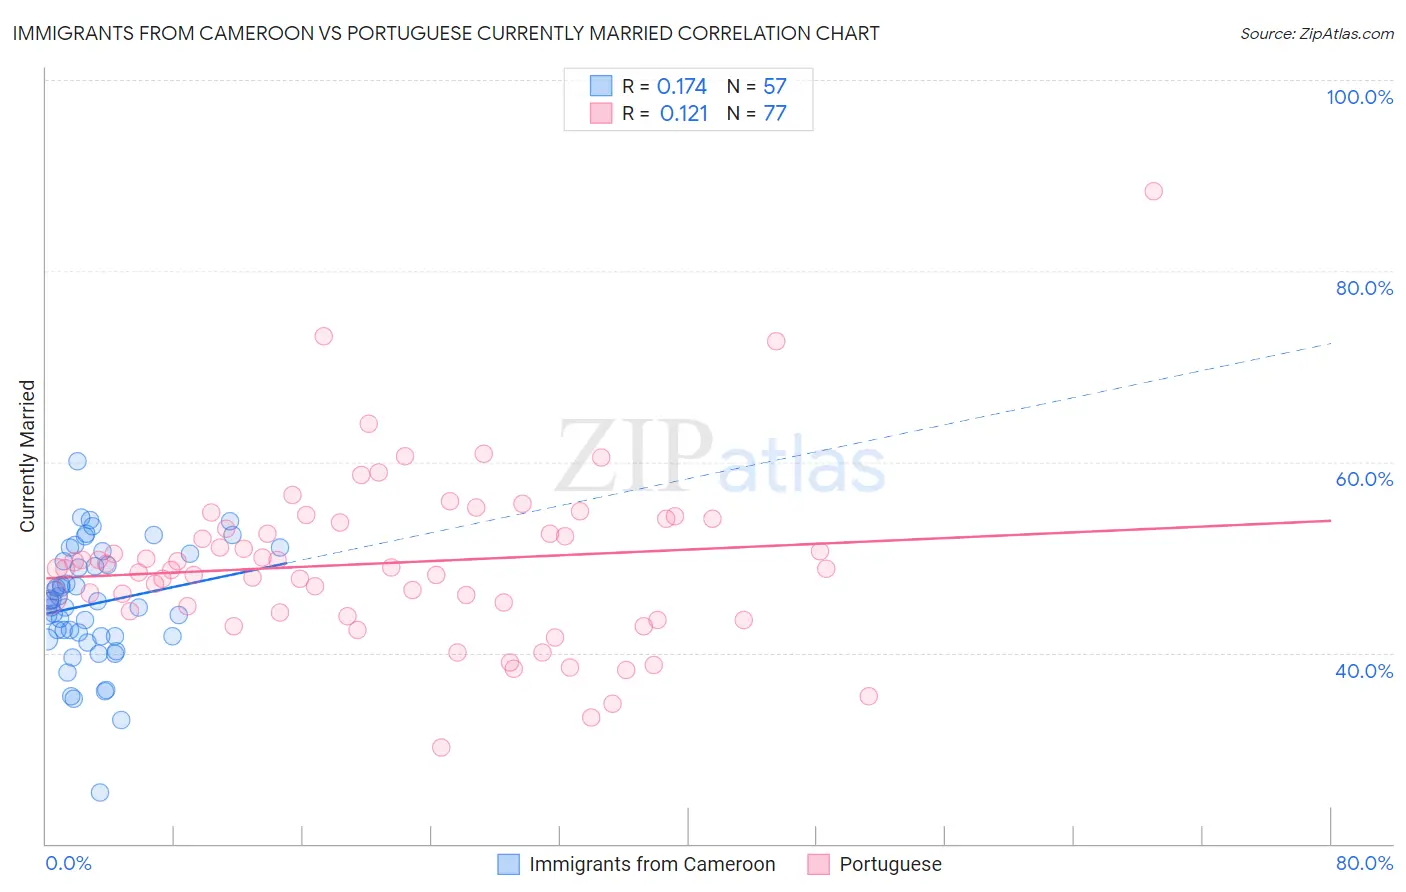
Immigrants from Cameroon vs Portuguese Currently Married Correlation Chart
The statistical analysis conducted on geographies consisting of 130,755,125 people shows a poor positive correlation between the proportion of Immigrants from Cameroon and percentage of population currently married in the United States with a correlation coefficient (R) of 0.174 and weighted average of 44.2%. Similarly, the statistical analysis conducted on geographies consisting of 450,286,612 people shows a poor positive correlation between the proportion of Portuguese and percentage of population currently married in the United States with a correlation coefficient (R) of 0.121 and weighted average of 47.3%, a difference of 7.1%.
Currently Married Correlation Summary
| Measurement | Immigrants from Cameroon | Portuguese |
| Minimum | 25.4% | 30.1% |
| Maximum | 60.1% | 88.3% |
| Range | 34.7% | 58.2% |
| Mean | 45.2% | 49.4% |
| Median | 45.4% | 48.9% |
| Interquartile 25% (IQ1) | 41.7% | 44.3% |
| Interquartile 75% (IQ3) | 50.0% | 53.9% |
| Interquartile Range (IQR) | 8.3% | 9.5% |
| Standard Deviation (Sample) | 6.2% | 8.9% |
| Standard Deviation (Population) | 6.1% | 8.9% |
Similar Demographics by Currently Married
Demographics Similar to Immigrants from Cameroon by Currently Married
In terms of currently married, the demographic groups most similar to Immigrants from Cameroon are Nicaraguan (44.2%, a difference of 0.020%), Immigrants from Eastern Africa (44.2%, a difference of 0.020%), Blackfeet (44.2%, a difference of 0.080%), Ugandan (44.2%, a difference of 0.10%), and Hispanic or Latino (44.1%, a difference of 0.11%).
| Demographics | Rating | Rank | Currently Married |
| Immigrants | Cambodia | 0.7 /100 | #242 | Tragic 44.5% |
| Immigrants | Ethiopia | 0.7 /100 | #243 | Tragic 44.5% |
| Japanese | 0.6 /100 | #244 | Tragic 44.5% |
| Immigrants | Armenia | 0.4 /100 | #245 | Tragic 44.3% |
| Immigrants | Burma/Myanmar | 0.4 /100 | #246 | Tragic 44.3% |
| Ugandans | 0.4 /100 | #247 | Tragic 44.2% |
| Nicaraguans | 0.3 /100 | #248 | Tragic 44.2% |
| Immigrants | Cameroon | 0.3 /100 | #249 | Tragic 44.2% |
| Immigrants | Eastern Africa | 0.3 /100 | #250 | Tragic 44.2% |
| Blackfeet | 0.3 /100 | #251 | Tragic 44.2% |
| Hispanics or Latinos | 0.3 /100 | #252 | Tragic 44.1% |
| Immigrants | Central America | 0.3 /100 | #253 | Tragic 44.1% |
| Vietnamese | 0.2 /100 | #254 | Tragic 44.0% |
| Yakama | 0.2 /100 | #255 | Tragic 44.0% |
| Shoshone | 0.2 /100 | #256 | Tragic 44.0% |
Demographics Similar to Portuguese by Currently Married
In terms of currently married, the demographic groups most similar to Portuguese are New Zealander (47.4%, a difference of 0.040%), Immigrants from Jordan (47.4%, a difference of 0.050%), Sri Lankan (47.3%, a difference of 0.060%), Okinawan (47.4%, a difference of 0.080%), and Immigrants from Iraq (47.3%, a difference of 0.090%).
| Demographics | Rating | Rank | Currently Married |
| Immigrants | Croatia | 88.6 /100 | #121 | Excellent 47.5% |
| Osage | 87.9 /100 | #122 | Excellent 47.5% |
| Immigrants | Kazakhstan | 87.2 /100 | #123 | Excellent 47.4% |
| Laotians | 86.6 /100 | #124 | Excellent 47.4% |
| Okinawans | 85.3 /100 | #125 | Excellent 47.4% |
| Immigrants | Jordan | 84.9 /100 | #126 | Excellent 47.4% |
| New Zealanders | 84.9 /100 | #127 | Excellent 47.4% |
| Portuguese | 84.2 /100 | #128 | Excellent 47.3% |
| Sri Lankans | 83.2 /100 | #129 | Excellent 47.3% |
| Immigrants | Iraq | 82.8 /100 | #130 | Excellent 47.3% |
| Icelanders | 82.4 /100 | #131 | Excellent 47.3% |
| Afghans | 81.8 /100 | #132 | Excellent 47.3% |
| Immigrants | Malaysia | 81.1 /100 | #133 | Excellent 47.3% |
| Immigrants | Australia | 81.1 /100 | #134 | Excellent 47.3% |
| Immigrants | Norway | 79.7 /100 | #135 | Good 47.2% |