Immigrants from Cameroon vs Irish Family Households with Children
COMPARE
Immigrants from Cameroon
Irish
Family Households with Children
Family Households with Children Comparison
Immigrants from Cameroon
Irish
29.2%
FAMILY HOUSEHOLDS WITH CHILDREN
100.0/ 100
METRIC RATING
37th/ 347
METRIC RANK
26.8%
FAMILY HOUSEHOLDS WITH CHILDREN
1.8/ 100
METRIC RATING
252nd/ 347
METRIC RANK
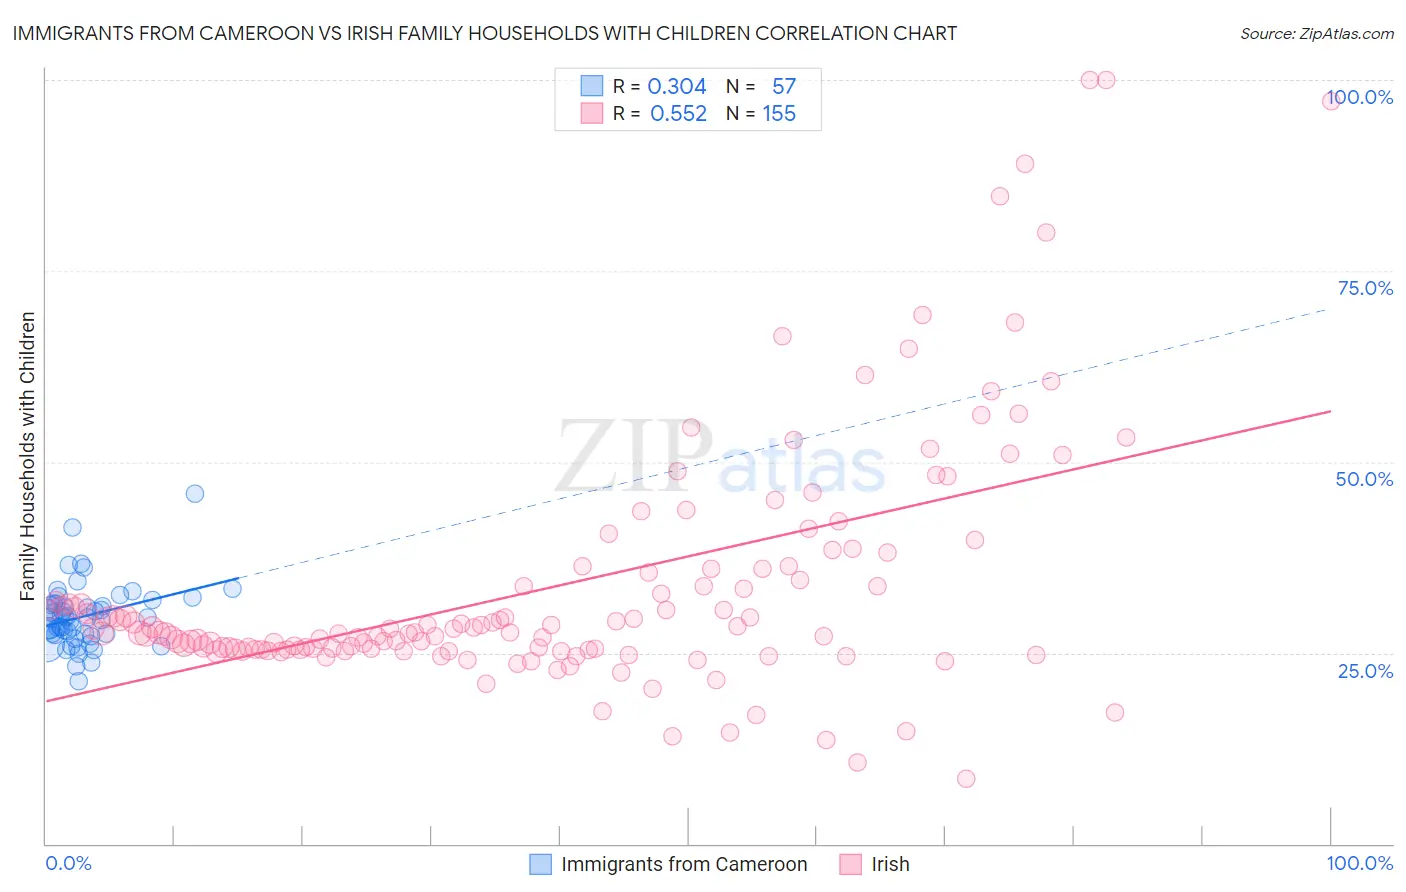
Immigrants from Cameroon vs Irish Family Households with Children Correlation Chart
The statistical analysis conducted on geographies consisting of 130,728,494 people shows a mild positive correlation between the proportion of Immigrants from Cameroon and percentage of family households with children in the United States with a correlation coefficient (R) of 0.304 and weighted average of 29.2%. Similarly, the statistical analysis conducted on geographies consisting of 579,410,491 people shows a substantial positive correlation between the proportion of Irish and percentage of family households with children in the United States with a correlation coefficient (R) of 0.552 and weighted average of 26.8%, a difference of 8.9%.
Family Households with Children Correlation Summary
| Measurement | Immigrants from Cameroon | Irish |
| Minimum | 21.2% | 8.5% |
| Maximum | 45.8% | 100.0% |
| Range | 24.6% | 91.5% |
| Mean | 29.8% | 33.6% |
| Median | 29.6% | 27.6% |
| Interquartile 25% (IQ1) | 27.4% | 25.4% |
| Interquartile 75% (IQ3) | 31.5% | 36.0% |
| Interquartile Range (IQR) | 4.1% | 10.5% |
| Standard Deviation (Sample) | 4.2% | 16.3% |
| Standard Deviation (Population) | 4.1% | 16.2% |
Similar Demographics by Family Households with Children
Demographics Similar to Immigrants from Cameroon by Family Households with Children
In terms of family households with children, the demographic groups most similar to Immigrants from Cameroon are Korean (29.2%, a difference of 0.14%), Immigrants from Venezuela (29.3%, a difference of 0.27%), Immigrants from Sierra Leone (29.3%, a difference of 0.28%), Yaqui (29.1%, a difference of 0.29%), and Central American (29.1%, a difference of 0.30%).
| Demographics | Rating | Rank | Family Households with Children |
| Yuman | 100.0 /100 | #30 | Exceptional 29.5% |
| Japanese | 100.0 /100 | #31 | Exceptional 29.4% |
| Immigrants | Yemen | 100.0 /100 | #32 | Exceptional 29.4% |
| Venezuelans | 100.0 /100 | #33 | Exceptional 29.4% |
| Immigrants | Bolivia | 100.0 /100 | #34 | Exceptional 29.3% |
| Immigrants | Sierra Leone | 100.0 /100 | #35 | Exceptional 29.3% |
| Immigrants | Venezuela | 100.0 /100 | #36 | Exceptional 29.3% |
| Immigrants | Cameroon | 100.0 /100 | #37 | Exceptional 29.2% |
| Koreans | 100.0 /100 | #38 | Exceptional 29.2% |
| Yaqui | 100.0 /100 | #39 | Exceptional 29.1% |
| Central Americans | 100.0 /100 | #40 | Exceptional 29.1% |
| Immigrants | South Eastern Asia | 100.0 /100 | #41 | Exceptional 29.1% |
| Spanish American Indians | 100.0 /100 | #42 | Exceptional 29.1% |
| Asians | 100.0 /100 | #43 | Exceptional 29.1% |
| Immigrants | Taiwan | 100.0 /100 | #44 | Exceptional 29.0% |
Demographics Similar to Irish by Family Households with Children
In terms of family households with children, the demographic groups most similar to Irish are Immigrants from Bosnia and Herzegovina (26.8%, a difference of 0.030%), Italian (26.8%, a difference of 0.080%), Belgian (26.9%, a difference of 0.090%), Immigrants from Eastern Europe (26.9%, a difference of 0.10%), and Immigrants from Scotland (26.8%, a difference of 0.10%).
| Demographics | Rating | Rank | Family Households with Children |
| Australians | 2.8 /100 | #245 | Tragic 26.9% |
| Jamaicans | 2.5 /100 | #246 | Tragic 26.9% |
| Potawatomi | 2.2 /100 | #247 | Tragic 26.9% |
| Immigrants | Kazakhstan | 2.2 /100 | #248 | Tragic 26.9% |
| Immigrants | Eastern Europe | 2.1 /100 | #249 | Tragic 26.9% |
| Belgians | 2.1 /100 | #250 | Tragic 26.9% |
| Immigrants | Bosnia and Herzegovina | 1.9 /100 | #251 | Tragic 26.8% |
| Irish | 1.8 /100 | #252 | Tragic 26.8% |
| Italians | 1.5 /100 | #253 | Tragic 26.8% |
| Immigrants | Scotland | 1.5 /100 | #254 | Tragic 26.8% |
| German Russians | 1.5 /100 | #255 | Tragic 26.8% |
| Scotch-Irish | 1.4 /100 | #256 | Tragic 26.8% |
| Slavs | 1.3 /100 | #257 | Tragic 26.8% |
| Immigrants | Cuba | 1.3 /100 | #258 | Tragic 26.8% |
| Immigrants | Lithuania | 1.2 /100 | #259 | Tragic 26.8% |