Immigrants from Cambodia vs Arapaho Currently Married

COMPARE

Immigrants from Cambodia
Race
Ancestry
AfghanAfricanAlaska NativeAlaskan AthabascanAlbanianAleutAlsatianAmericanApacheArabArgentineanArmenianAssyrian/Chaldean/SyriacAustralianAustrianBahamianBangladeshiBarbadianBasqueBelgianBelizeanBermudanBhutaneseBlackfeetBolivianBrazilianBritishBritish West IndianBulgarianBurmeseCajunCambodianCanadianCape VerdeanCarpatho RusynCelticCentral AmericanCentral American IndianCherokeeCheyenneChickasawChileanChineseChippewaChoctawColombianColvilleComancheCosta RicanCreeCreekCroatianCrowCubanCypriotCzechCzechoslovakianDanishDelawareDominicanDutchDutch West IndianEastern EuropeanEcuadorianEgyptianEnglishEstonianEthiopianEuropeanFijianFilipinoFinnishFrenchFrench American IndianFrench CanadianGermanGerman RussianGhanaianGreekGuamanian/ChamorroGuatemalanGuyaneseHaitianHmongHonduranHopiHoumaHungarianIcelanderIndian (Asian)IndonesianInupiatIranianIraqiIrishIroquoisIsraeliItalianJamaicanJapaneseJordanianKenyanKiowaKoreanLaotianLatvianLebaneseLiberianLithuanianLumbeeLuxembourgerMacedonianMalaysianMalteseMarshalleseMenomineeMexicanMexican American IndianMongolianMoroccanNative HawaiianNavajoNepaleseNew ZealanderNicaraguanNigerianNorthern EuropeanNorwegianOkinawanOsageOttawaPaiutePakistaniPalestinianPanamanianParaguayanPennsylvania GermanPeruvianPimaPolishPortuguesePotawatomiPuebloPuerto RicanPuget Sound SalishRomanianRussianSalvadoranSamoanScandinavianScotch-IrishScottishSeminoleSenegaleseSerbianShoshoneSierra LeoneanSiouxSlavicSlovakSloveneSomaliSouth AfricanSouth AmericanSouth American IndianSoviet UnionSpaniardSpanishSpanish AmericanSpanish American IndianSri LankanSubsaharan AfricanSudaneseSwedishSwissSyrianTaiwaneseThaiTlingit-HaidaTohono O'OdhamTonganTrinidadian and TobagonianTsimshianTurkishU.S. Virgin IslanderUgandanUkrainianUruguayanUteVenezuelanVietnameseWelshWest IndianYakamaYaquiYugoslavianYumanYup'ikZimbabwean
Immigration
NonimmigrantsImmigrantsAfghanistanAfricaAlbaniaArgentinaArmeniaAsiaAustraliaAustriaBahamasBangladeshBarbadosBelarusBelgiumBelizeBoliviaBosnia and HerzegovinaBrazilBulgariaBurma/MyanmarCabo VerdeCambodiaCameroonCanadaCaribbeanCentral AmericaChileChinaColombiaCongoCosta RicaCroatiaCubaCzechoslovakiaDenmarkDominicaDominican RepublicEastern AfricaEastern AsiaEastern EuropeEcuadorEgyptEl SalvadorEnglandEritreaEthiopiaEuropeFijiFranceGermanyGhanaGreeceGrenadaGuatemalaGuyanaHaitiHondurasHong KongHungaryIndiaIndonesiaIranIraqIrelandIsraelItalyJamaicaJapanJordanKazakhstanKenyaKoreaKuwaitLaosLatin AmericaLatviaLebanonLiberiaLithuaniaMalaysiaMexicoMicronesiaMiddle AfricaMoldovaMoroccoNepalNetherlandsNicaraguaNigeriaNorth AmericaNorth MacedoniaNorthern AfricaNorthern EuropeNorwayOceaniaPakistanPanamaPeruPhilippinesPolandPortugalRomaniaRussiaSaudi ArabiaScotlandSenegalSerbiaSierra LeoneSingaporeSomaliaSouth AfricaSouth AmericaSouth Central AsiaSouth Eastern AsiaSouthern EuropeSpainSri LankaSt. Vincent and the GrenadinesSudanSwedenSwitzerlandSyriaTaiwanThailandTrinidad and TobagoTurkeyUgandaUkraineUruguayUzbekistanVenezuelaVietnamWest IndiesWestern AfricaWestern AsiaWestern EuropeYemenZaireZimbabweAzores
Arapaho
Race
Ancestry
AfghanAfricanAlaska NativeAlaskan AthabascanAlbanianAleutAlsatianAmericanApacheArabArapahoArgentineanArmenianAssyrian/Chaldean/SyriacAustralianAustrianBahamianBangladeshiBarbadianBasqueBelgianBelizeanBermudanBhutaneseBlackfeetBolivianBrazilianBritishBritish West IndianBulgarianBurmeseCajunCambodianCanadianCape VerdeanCarpatho RusynCelticCentral AmericanCentral American IndianCherokeeCheyenneChickasawChileanChineseChippewaChoctawColombianColvilleComancheCosta RicanCreeCreekCroatianCrowCubanCypriotCzechCzechoslovakianDanishDelawareDominicanDutchDutch West IndianEastern EuropeanEcuadorianEgyptianEnglishEstonianEthiopianEuropeanFijianFilipinoFinnishFrenchFrench American IndianFrench CanadianGermanGerman RussianGhanaianGreekGuamanian/ChamorroGuatemalanGuyaneseHaitianHmongHonduranHopiHoumaHungarianIcelanderIndian (Asian)IndonesianInupiatIranianIraqiIrishIroquoisIsraeliItalianJamaicanJapaneseJordanianKenyanKiowaKoreanLaotianLatvianLebaneseLiberianLithuanianLumbeeLuxembourgerMacedonianMalaysianMalteseMarshalleseMenomineeMexicanMexican American IndianMongolianMoroccanNative HawaiianNavajoNepaleseNew ZealanderNicaraguanNigerianNorthern EuropeanNorwegianOkinawanOsageOttawaPaiutePakistaniPalestinianPanamanianParaguayanPennsylvania GermanPeruvianPimaPolishPortuguesePotawatomiPuebloPuerto RicanPuget Sound SalishRomanianRussianSalvadoranSamoanScandinavianScotch-IrishScottishSeminoleSenegaleseSerbianShoshoneSierra LeoneanSiouxSlavicSlovakSloveneSomaliSouth AfricanSouth AmericanSouth American IndianSoviet UnionSpaniardSpanishSpanish AmericanSpanish American IndianSri LankanSubsaharan AfricanSudaneseSwedishSwissSyrianTaiwaneseThaiTlingit-HaidaTohono O'OdhamTonganTrinidadian and TobagonianTsimshianTurkishU.S. Virgin IslanderUgandanUkrainianUruguayanUteVenezuelanVietnameseWelshWest IndianYakamaYaquiYugoslavianYumanYup'ikZimbabwean
Immigration
NonimmigrantsImmigrantsAfghanistanAfricaAlbaniaArgentinaArmeniaAsiaAustraliaAustriaBahamasBangladeshBarbadosBelarusBelgiumBelizeBoliviaBosnia and HerzegovinaBrazilBulgariaBurma/MyanmarCabo VerdeCameroonCanadaCaribbeanCentral AmericaChileChinaColombiaCongoCosta RicaCroatiaCubaCzechoslovakiaDenmarkDominicaDominican RepublicEastern AfricaEastern AsiaEastern EuropeEcuadorEgyptEl SalvadorEnglandEritreaEthiopiaEuropeFijiFranceGermanyGhanaGreeceGrenadaGuatemalaGuyanaHaitiHondurasHong KongHungaryIndiaIndonesiaIranIraqIrelandIsraelItalyJamaicaJapanJordanKazakhstanKenyaKoreaKuwaitLaosLatin AmericaLatviaLebanonLiberiaLithuaniaMalaysiaMexicoMicronesiaMiddle AfricaMoldovaMoroccoNepalNetherlandsNicaraguaNigeriaNorth AmericaNorth MacedoniaNorthern AfricaNorthern EuropeNorwayOceaniaPakistanPanamaPeruPhilippinesPolandPortugalRomaniaRussiaSaudi ArabiaScotlandSenegalSerbiaSierra LeoneSingaporeSomaliaSouth AfricaSouth AmericaSouth Central AsiaSouth Eastern AsiaSouthern EuropeSpainSri LankaSt. Vincent and the GrenadinesSudanSwedenSwitzerlandSyriaTaiwanThailandTrinidad and TobagoTurkeyUgandaUkraineUruguayUzbekistanVenezuelaVietnamWest IndiesWestern AfricaWestern AsiaWestern EuropeYemenZaireZimbabweAzores
Currently Married
Income
Poverty
Unemployment
Labor Participation
Family Structure
Vehicle Availability
Education Level
Disability

Currently Married Comparison

Immigrants from Cambodia

Arapaho

Tragic
Tragic
44.5%
CURRENTLY MARRIED
0.7/ 100
METRIC RATING
242nd/ 347
METRIC RANK
40.5%
CURRENTLY MARRIED
0.0/ 100
METRIC RATING
328th/ 347
METRIC RANK

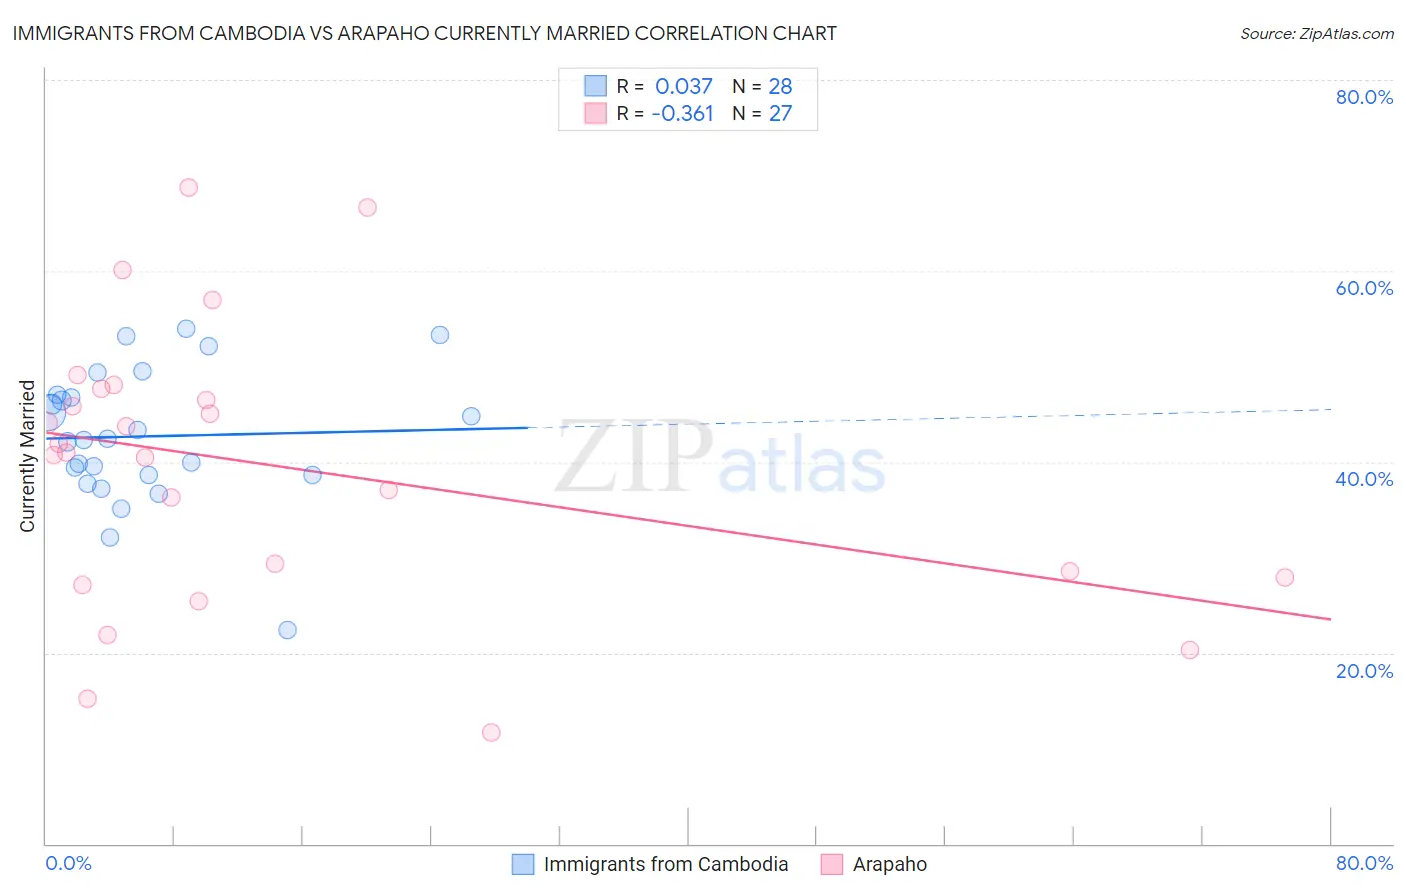
Immigrants from Cambodia vs Arapaho Currently Married Correlation Chart

The statistical analysis conducted on geographies consisting of 205,155,379 people shows no correlation between the proportion of Immigrants from Cambodia and percentage of population currently married in the United States with a correlation coefficient (R) of 0.037 and weighted average of 44.5%. Similarly, the statistical analysis conducted on geographies consisting of 29,779,567 people shows a mild negative correlation between the proportion of Arapaho and percentage of population currently married in the United States with a correlation coefficient (R) of -0.361 and weighted average of 40.5%, a difference of 9.8%.
Immigrants from Cambodia vs Arapaho Currently Married

Currently Married Correlation Summary

MeasurementImmigrants from CambodiaArapaho
Minimum22.4%11.7%
Maximum53.9%68.7%
Range31.5%57.0%
Mean42.7%39.5%
Median42.3%41.0%
Interquartile 25% (IQ1)38.6%27.9%
Interquartile 75% (IQ3)46.9%47.6%
Interquartile Range (IQR)8.3%19.7%
Standard Deviation (Sample)7.1%14.5%
Standard Deviation (Population)6.9%14.3%

Similar Demographics by Currently Married

Demographics Similar to Immigrants from Cambodia by Currently Married

In terms of currently married, the demographic groups most similar to Immigrants from Cambodia are Immigrants from Ethiopia (44.5%, a difference of 0.010%), Ethiopian (44.5%, a difference of 0.030%), Immigrants from Mexico (44.5%, a difference of 0.090%), Mexican American Indian (44.5%, a difference of 0.090%), and Japanese (44.5%, a difference of 0.090%).
DemographicsRating | RankCurrently Married
Alaskan Athabascans
0.9
/100
|
#235
Tragic
44.6%
Cubans
0.9
/100
|
#236
Tragic
44.6%
Seminole
0.9
/100
|
#237
Tragic
44.6%
Moroccans
0.9
/100
|
#238
Tragic
44.6%
Immigrants | Mexico
0.7
/100
|
#239
Tragic
44.5%
Mexican American Indians
0.7
/100
|
#240
Tragic
44.5%
Ethiopians
0.7
/100
|
#241
Tragic
44.5%
Immigrants | Cambodia
0.7
/100
|
#242
Tragic
44.5%
Immigrants | Ethiopia
0.7
/100
|
#243
Tragic
44.5%
Japanese
0.6
/100
|
#244
Tragic
44.5%
Immigrants | Armenia
0.4
/100
|
#245
Tragic
44.3%
Immigrants | Burma/Myanmar
0.4
/100
|
#246
Tragic
44.3%
Ugandans
0.4
/100
|
#247
Tragic
44.2%
Nicaraguans
0.3
/100
|
#248
Tragic
44.2%
Immigrants | Cameroon
0.3
/100
|
#249
Tragic
44.2%

Demographics Similar to Arapaho by Currently Married

In terms of currently married, the demographic groups most similar to Arapaho are Senegalese (40.6%, a difference of 0.040%), Barbadian (40.6%, a difference of 0.22%), U.S. Virgin Islander (40.7%, a difference of 0.35%), Immigrants from Senegal (40.7%, a difference of 0.40%), and Immigrants from West Indies (40.7%, a difference of 0.41%).
DemographicsRating | RankCurrently Married
Immigrants | Congo
0.0
/100
|
#321
Tragic
41.1%
Immigrants | Haiti
0.0
/100
|
#322
Tragic
41.0%
Immigrants | West Indies
0.0
/100
|
#323
Tragic
40.7%
Immigrants | Senegal
0.0
/100
|
#324
Tragic
40.7%
U.S. Virgin Islanders
0.0
/100
|
#325
Tragic
40.7%
Barbadians
0.0
/100
|
#326
Tragic
40.6%
Senegalese
0.0
/100
|
#327
Tragic
40.6%
Arapaho
0.0
/100
|
#328
Tragic
40.5%
Crow
0.0
/100
|
#329
Tragic
40.4%
Immigrants | Dominica
0.0
/100
|
#330
Tragic
40.3%
Immigrants | Barbados
0.0
/100
|
#331
Tragic
40.3%
Immigrants | St. Vincent and the Grenadines
0.0
/100
|
#332
Tragic
40.1%
Yup'ik
0.0
/100
|
#333
Tragic
39.9%
Puerto Ricans
0.0
/100
|
#334
Tragic
39.9%
Lumbee
0.0
/100
|
#335
Tragic
39.8%