Immigrants from Brazil vs Japanese Single Father Households
COMPARE
Immigrants from Brazil
Japanese
Single Father Households
Single Father Households Comparison
Immigrants from Brazil
Japanese
2.2%
SINGLE FATHER HOUSEHOLDS
97.7/ 100
METRIC RATING
121st/ 347
METRIC RANK
2.8%
SINGLE FATHER HOUSEHOLDS
0.0/ 100
METRIC RATING
296th/ 347
METRIC RANK
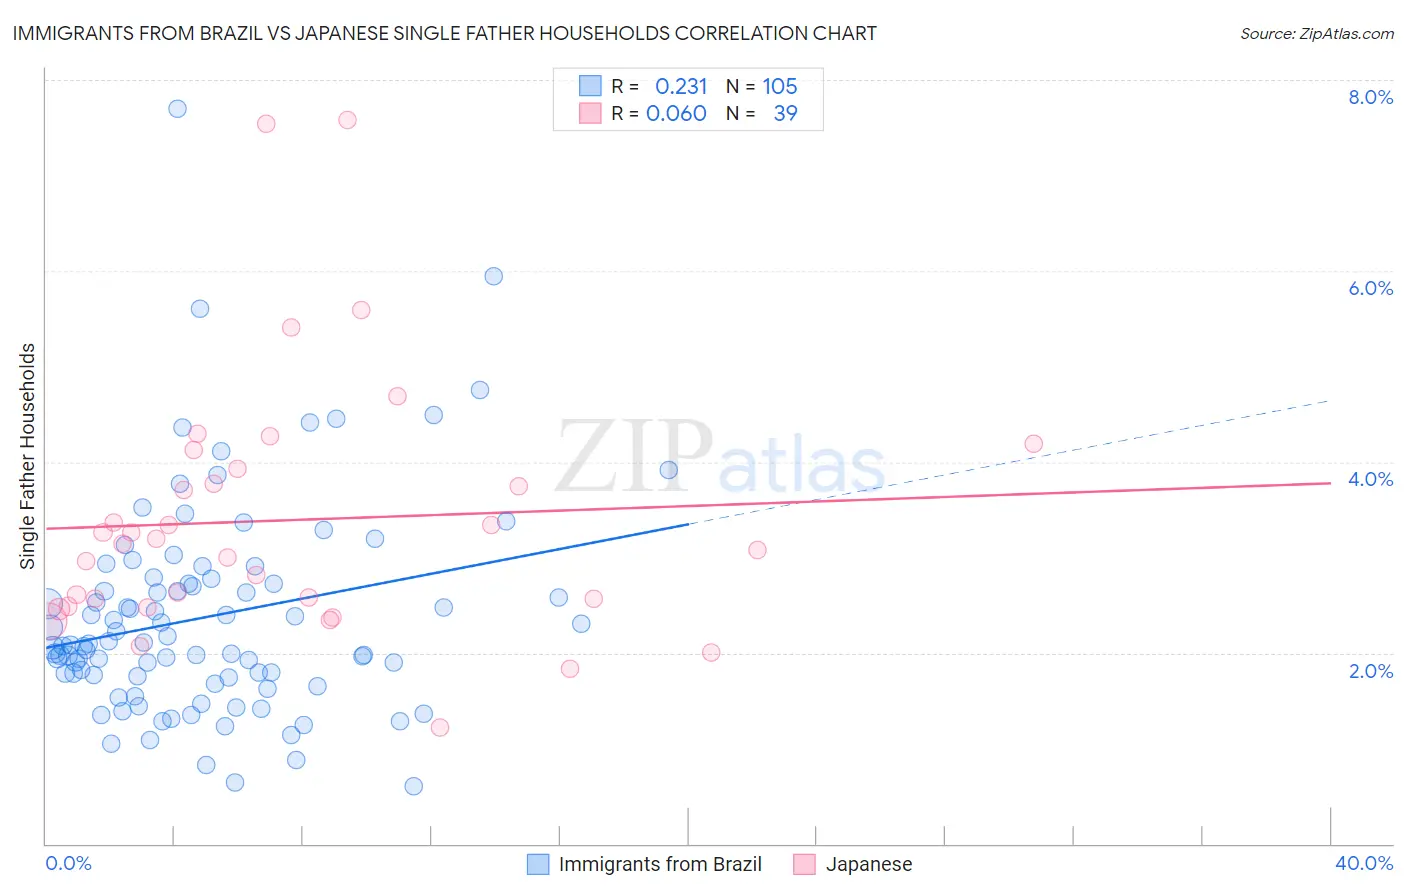
Immigrants from Brazil vs Japanese Single Father Households Correlation Chart
The statistical analysis conducted on geographies consisting of 340,503,881 people shows a weak positive correlation between the proportion of Immigrants from Brazil and percentage of single father households in the United States with a correlation coefficient (R) of 0.231 and weighted average of 2.2%. Similarly, the statistical analysis conducted on geographies consisting of 248,286,499 people shows a slight positive correlation between the proportion of Japanese and percentage of single father households in the United States with a correlation coefficient (R) of 0.060 and weighted average of 2.8%, a difference of 26.5%.
Single Father Households Correlation Summary
| Measurement | Immigrants from Brazil | Japanese |
| Minimum | 0.60% | 1.2% |
| Maximum | 7.7% | 7.6% |
| Range | 7.1% | 6.4% |
| Mean | 2.4% | 3.4% |
| Median | 2.1% | 3.1% |
| Interquartile 25% (IQ1) | 1.7% | 2.5% |
| Interquartile 75% (IQ3) | 2.8% | 3.9% |
| Interquartile Range (IQR) | 1.0% | 1.4% |
| Standard Deviation (Sample) | 1.1% | 1.4% |
| Standard Deviation (Population) | 1.1% | 1.3% |
Similar Demographics by Single Father Households
Demographics Similar to Immigrants from Brazil by Single Father Households
In terms of single father households, the demographic groups most similar to Immigrants from Brazil are Australian (2.2%, a difference of 0.0%), Trinidadian and Tobagonian (2.2%, a difference of 0.040%), Immigrants from Morocco (2.2%, a difference of 0.090%), Immigrants from Iraq (2.2%, a difference of 0.10%), and Hungarian (2.2%, a difference of 0.19%).
| Demographics | Rating | Rank | Single Father Households |
| Immigrants | North America | 98.2 /100 | #114 | Exceptional 2.2% |
| Immigrants | Barbados | 98.2 /100 | #115 | Exceptional 2.2% |
| Immigrants | Argentina | 98.1 /100 | #116 | Exceptional 2.2% |
| Hungarians | 97.9 /100 | #117 | Exceptional 2.2% |
| Immigrants | Morocco | 97.8 /100 | #118 | Exceptional 2.2% |
| Trinidadians and Tobagonians | 97.8 /100 | #119 | Exceptional 2.2% |
| Australians | 97.7 /100 | #120 | Exceptional 2.2% |
| Immigrants | Brazil | 97.7 /100 | #121 | Exceptional 2.2% |
| Immigrants | Iraq | 97.6 /100 | #122 | Exceptional 2.2% |
| Immigrants | Yemen | 97.5 /100 | #123 | Exceptional 2.2% |
| British West Indians | 97.4 /100 | #124 | Exceptional 2.2% |
| Immigrants | Indonesia | 97.4 /100 | #125 | Exceptional 2.2% |
| Moroccans | 96.9 /100 | #126 | Exceptional 2.2% |
| Jordanians | 96.9 /100 | #127 | Exceptional 2.2% |
| Immigrants | England | 96.8 /100 | #128 | Exceptional 2.2% |
Demographics Similar to Japanese by Single Father Households
In terms of single father households, the demographic groups most similar to Japanese are Chickasaw (2.8%, a difference of 0.020%), Honduran (2.8%, a difference of 0.080%), Cree (2.8%, a difference of 0.57%), Malaysian (2.7%, a difference of 0.83%), and Lumbee (2.8%, a difference of 0.95%).
| Demographics | Rating | Rank | Single Father Households |
| Tlingit-Haida | 0.0 /100 | #289 | Tragic 2.7% |
| Puget Sound Salish | 0.0 /100 | #290 | Tragic 2.7% |
| Blackfeet | 0.0 /100 | #291 | Tragic 2.7% |
| Choctaw | 0.0 /100 | #292 | Tragic 2.7% |
| Immigrants | Fiji | 0.0 /100 | #293 | Tragic 2.7% |
| Malaysians | 0.0 /100 | #294 | Tragic 2.7% |
| Chickasaw | 0.0 /100 | #295 | Tragic 2.8% |
| Japanese | 0.0 /100 | #296 | Tragic 2.8% |
| Hondurans | 0.0 /100 | #297 | Tragic 2.8% |
| Cree | 0.0 /100 | #298 | Tragic 2.8% |
| Lumbee | 0.0 /100 | #299 | Tragic 2.8% |
| Kiowa | 0.0 /100 | #300 | Tragic 2.8% |
| Immigrants | Latin America | 0.0 /100 | #301 | Tragic 2.8% |
| Spanish Americans | 0.0 /100 | #302 | Tragic 2.8% |
| Immigrants | Honduras | 0.0 /100 | #303 | Tragic 2.8% |