Immigrants from Bosnia and Herzegovina vs Dutch West Indian Single Father Households
COMPARE
Immigrants from Bosnia and Herzegovina
Dutch West Indian
Single Father Households
Single Father Households Comparison
Immigrants from Bosnia and Herzegovina
Dutch West Indians
2.4%
SINGLE FATHER HOUSEHOLDS
40.4/ 100
METRIC RATING
186th/ 347
METRIC RANK
2.6%
SINGLE FATHER HOUSEHOLDS
0.1/ 100
METRIC RATING
282nd/ 347
METRIC RANK
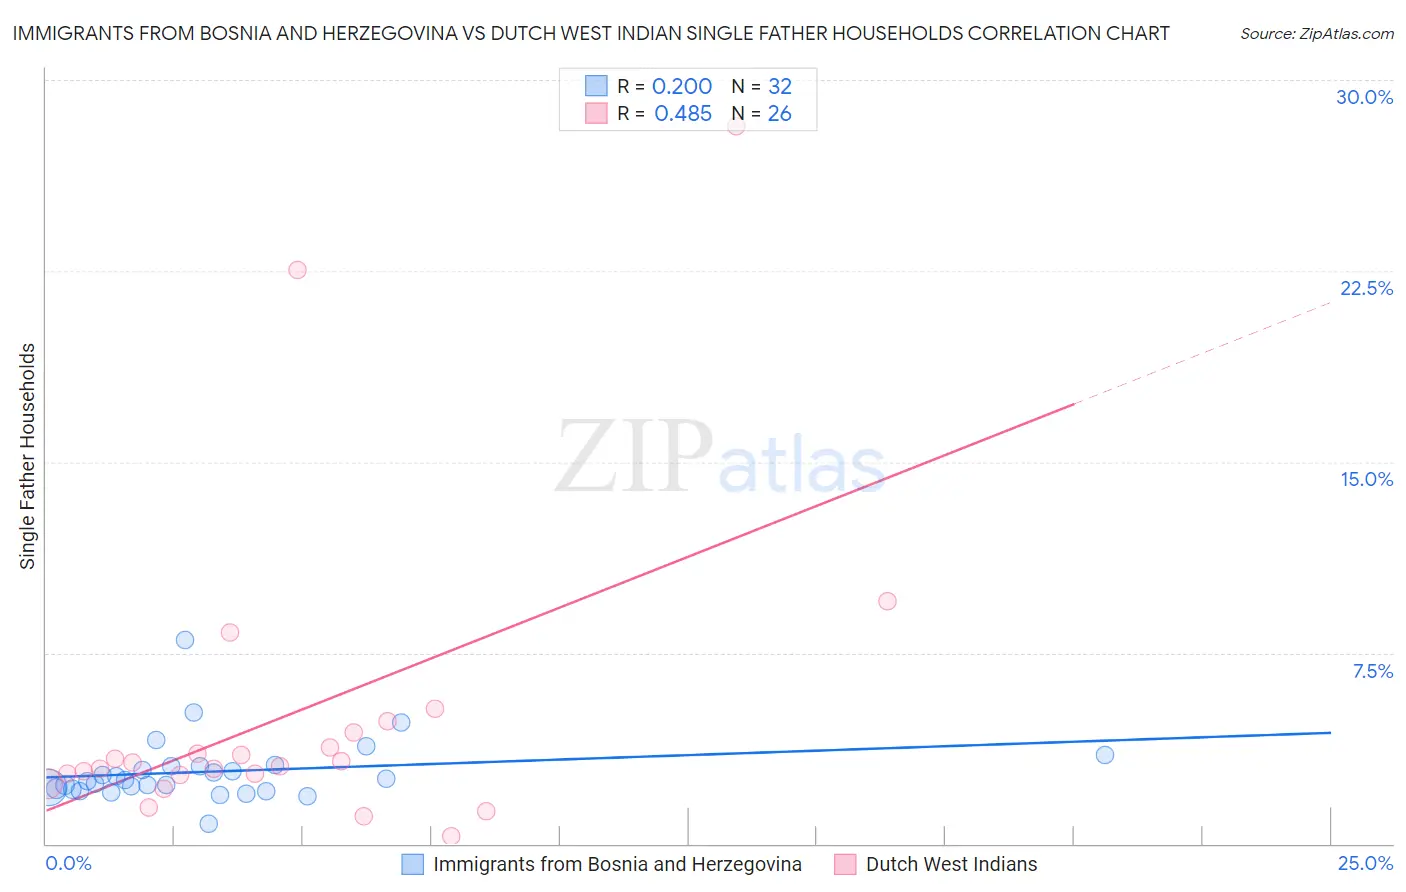
Immigrants from Bosnia and Herzegovina vs Dutch West Indian Single Father Households Correlation Chart
The statistical analysis conducted on geographies consisting of 156,499,635 people shows a weak positive correlation between the proportion of Immigrants from Bosnia and Herzegovina and percentage of single father households in the United States with a correlation coefficient (R) of 0.200 and weighted average of 2.4%. Similarly, the statistical analysis conducted on geographies consisting of 85,485,397 people shows a moderate positive correlation between the proportion of Dutch West Indians and percentage of single father households in the United States with a correlation coefficient (R) of 0.485 and weighted average of 2.6%, a difference of 12.1%.
Single Father Households Correlation Summary
| Measurement | Immigrants from Bosnia and Herzegovina | Dutch West Indian |
| Minimum | 0.77% | 0.30% |
| Maximum | 8.0% | 28.2% |
| Range | 7.3% | 27.9% |
| Mean | 2.8% | 5.1% |
| Median | 2.5% | 3.1% |
| Interquartile 25% (IQ1) | 2.1% | 2.7% |
| Interquartile 75% (IQ3) | 3.1% | 4.4% |
| Interquartile Range (IQR) | 0.90% | 1.6% |
| Standard Deviation (Sample) | 1.3% | 6.3% |
| Standard Deviation (Population) | 1.3% | 6.2% |
Similar Demographics by Single Father Households
Demographics Similar to Immigrants from Bosnia and Herzegovina by Single Father Households
In terms of single father households, the demographic groups most similar to Immigrants from Bosnia and Herzegovina are Nigerian (2.4%, a difference of 0.050%), Sri Lankan (2.4%, a difference of 0.10%), Immigrants from Panama (2.4%, a difference of 0.11%), Belgian (2.3%, a difference of 0.21%), and Jamaican (2.3%, a difference of 0.23%).
| Demographics | Rating | Rank | Single Father Households |
| Welsh | 44.0 /100 | #179 | Average 2.3% |
| Yugoslavians | 43.9 /100 | #180 | Average 2.3% |
| Jamaicans | 43.5 /100 | #181 | Average 2.3% |
| Belgians | 43.3 /100 | #182 | Average 2.3% |
| Immigrants | Panama | 41.8 /100 | #183 | Average 2.4% |
| Sri Lankans | 41.8 /100 | #184 | Average 2.4% |
| Nigerians | 41.0 /100 | #185 | Average 2.4% |
| Immigrants | Bosnia and Herzegovina | 40.4 /100 | #186 | Average 2.4% |
| Immigrants | Colombia | 34.0 /100 | #187 | Fair 2.4% |
| Hmong | 33.0 /100 | #188 | Fair 2.4% |
| U.S. Virgin Islanders | 31.8 /100 | #189 | Fair 2.4% |
| French | 31.7 /100 | #190 | Fair 2.4% |
| Immigrants | Africa | 30.0 /100 | #191 | Fair 2.4% |
| Immigrants | Sudan | 29.8 /100 | #192 | Fair 2.4% |
| Uruguayans | 29.7 /100 | #193 | Fair 2.4% |
Demographics Similar to Dutch West Indians by Single Father Households
In terms of single father households, the demographic groups most similar to Dutch West Indians are Nicaraguan (2.6%, a difference of 0.050%), Immigrants from Portugal (2.6%, a difference of 0.060%), Samoan (2.6%, a difference of 0.61%), Cherokee (2.6%, a difference of 0.65%), and Immigrants from Nicaragua (2.7%, a difference of 0.69%).
| Demographics | Rating | Rank | Single Father Households |
| Immigrants | Dominican Republic | 0.2 /100 | #275 | Tragic 2.6% |
| Immigrants | Haiti | 0.1 /100 | #276 | Tragic 2.6% |
| Shoshone | 0.1 /100 | #277 | Tragic 2.6% |
| Cherokee | 0.1 /100 | #278 | Tragic 2.6% |
| Samoans | 0.1 /100 | #279 | Tragic 2.6% |
| Immigrants | Portugal | 0.1 /100 | #280 | Tragic 2.6% |
| Nicaraguans | 0.1 /100 | #281 | Tragic 2.6% |
| Dutch West Indians | 0.1 /100 | #282 | Tragic 2.6% |
| Immigrants | Nicaragua | 0.1 /100 | #283 | Tragic 2.7% |
| Hawaiians | 0.1 /100 | #284 | Tragic 2.7% |
| Ottawa | 0.1 /100 | #285 | Tragic 2.7% |
| Immigrants | Cuba | 0.1 /100 | #286 | Tragic 2.7% |
| Central American Indians | 0.0 /100 | #287 | Tragic 2.7% |
| Immigrants | Cambodia | 0.0 /100 | #288 | Tragic 2.7% |
| Tlingit-Haida | 0.0 /100 | #289 | Tragic 2.7% |