Immigrants from Bosnia and Herzegovina vs Alsatian Currently Married
COMPARE
Immigrants from Bosnia and Herzegovina
Alsatian
Currently Married
Currently Married Comparison
Immigrants from Bosnia and Herzegovina
Alsatians
46.1%
CURRENTLY MARRIED
22.2/ 100
METRIC RATING
196th/ 347
METRIC RANK
45.7%
CURRENTLY MARRIED
10.8/ 100
METRIC RATING
208th/ 347
METRIC RANK
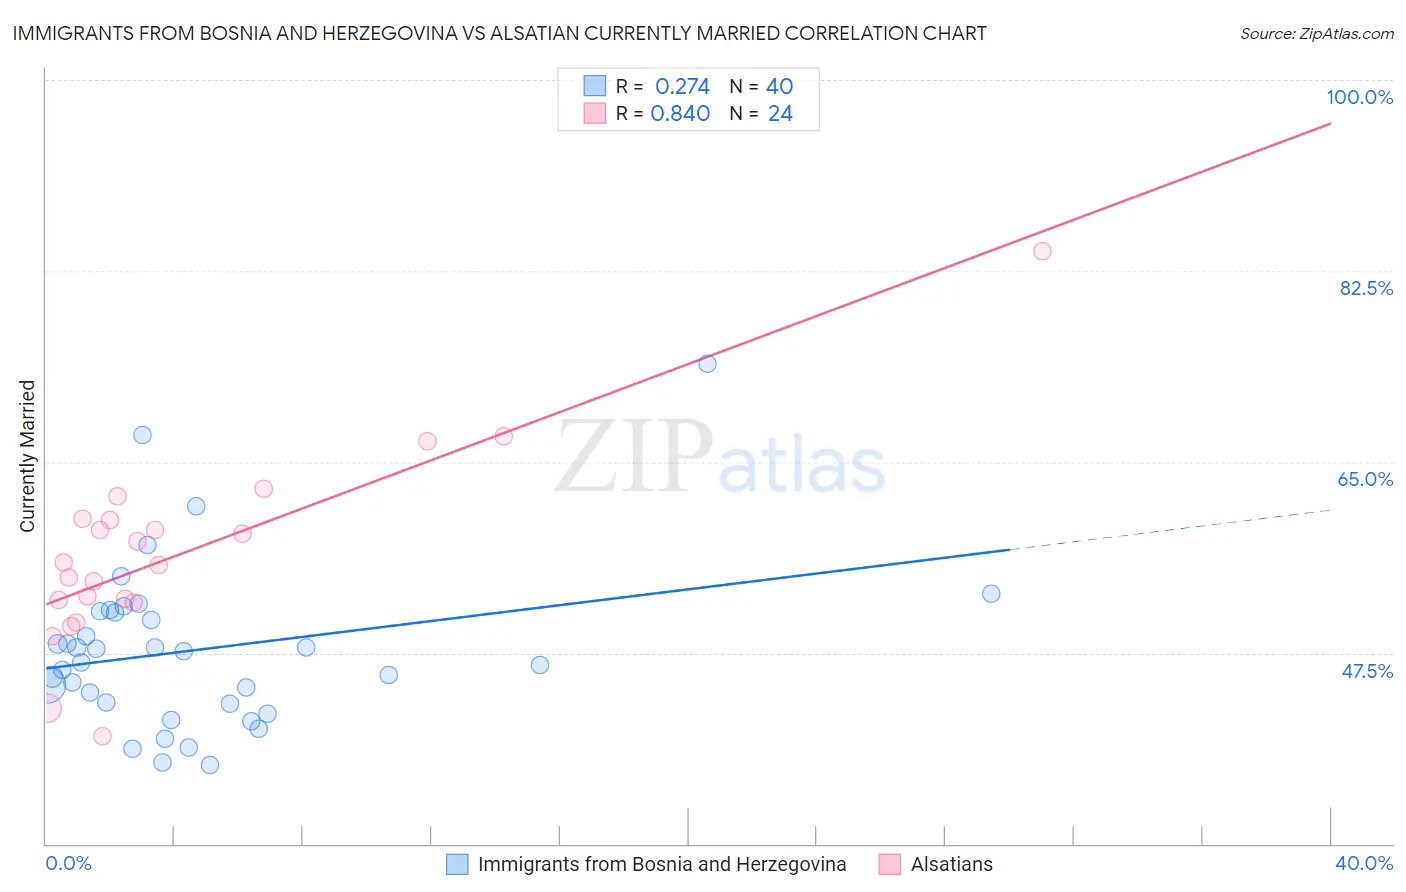
Immigrants from Bosnia and Herzegovina vs Alsatian Currently Married Correlation Chart
The statistical analysis conducted on geographies consisting of 156,809,544 people shows a weak positive correlation between the proportion of Immigrants from Bosnia and Herzegovina and percentage of population currently married in the United States with a correlation coefficient (R) of 0.274 and weighted average of 46.1%. Similarly, the statistical analysis conducted on geographies consisting of 82,681,658 people shows a very strong positive correlation between the proportion of Alsatians and percentage of population currently married in the United States with a correlation coefficient (R) of 0.840 and weighted average of 45.7%, a difference of 0.80%.
Currently Married Correlation Summary
| Measurement | Immigrants from Bosnia and Herzegovina | Alsatian |
| Minimum | 37.2% | 39.9% |
| Maximum | 74.0% | 84.3% |
| Range | 36.8% | 44.4% |
| Mean | 47.8% | 56.5% |
| Median | 47.1% | 55.7% |
| Interquartile 25% (IQ1) | 42.9% | 52.2% |
| Interquartile 75% (IQ3) | 51.3% | 59.7% |
| Interquartile Range (IQR) | 8.4% | 7.5% |
| Standard Deviation (Sample) | 7.6% | 8.8% |
| Standard Deviation (Population) | 7.5% | 8.6% |
Demographics Similar to Immigrants from Bosnia and Herzegovina and Alsatians by Currently Married
In terms of currently married, the demographic groups most similar to Immigrants from Bosnia and Herzegovina are Immigrants from Kuwait (46.1%, a difference of 0.030%), Immigrants from Nepal (46.1%, a difference of 0.070%), Immigrants from Colombia (46.1%, a difference of 0.070%), South American (46.1%, a difference of 0.080%), and Immigrants from Fiji (46.2%, a difference of 0.14%). Similarly, the demographic groups most similar to Alsatians are Immigrants from South America (45.7%, a difference of 0.010%), Immigrants (45.8%, a difference of 0.050%), South American Indian (45.8%, a difference of 0.070%), Immigrants from Spain (45.8%, a difference of 0.080%), and Taiwanese (45.8%, a difference of 0.090%).
| Demographics | Rating | Rank | Currently Married |
| Soviet Union | 25.7 /100 | #192 | Fair 46.2% |
| Immigrants | Fiji | 25.0 /100 | #193 | Fair 46.2% |
| South Americans | 23.8 /100 | #194 | Fair 46.1% |
| Immigrants | Nepal | 23.7 /100 | #195 | Fair 46.1% |
| Immigrants | Bosnia and Herzegovina | 22.2 /100 | #196 | Fair 46.1% |
| Immigrants | Kuwait | 21.7 /100 | #197 | Fair 46.1% |
| Immigrants | Colombia | 21.0 /100 | #198 | Fair 46.1% |
| Immigrants | Costa Rica | 19.6 /100 | #199 | Poor 46.0% |
| Creek | 17.2 /100 | #200 | Poor 46.0% |
| Malaysians | 15.3 /100 | #201 | Poor 45.9% |
| Immigrants | Albania | 14.5 /100 | #202 | Poor 45.9% |
| Taiwanese | 11.7 /100 | #203 | Poor 45.8% |
| Immigrants | Spain | 11.6 /100 | #204 | Poor 45.8% |
| South American Indians | 11.5 /100 | #205 | Poor 45.8% |
| Immigrants | Immigrants | 11.2 /100 | #206 | Poor 45.8% |
| Immigrants | South America | 10.8 /100 | #207 | Poor 45.7% |
| Alsatians | 10.8 /100 | #208 | Poor 45.7% |
| Immigrants | Micronesia | 8.8 /100 | #209 | Tragic 45.6% |
| Uruguayans | 7.9 /100 | #210 | Tragic 45.6% |
| Houma | 7.2 /100 | #211 | Tragic 45.5% |
| Marshallese | 7.2 /100 | #212 | Tragic 45.5% |