Immigrants from Bolivia vs Mongolian Births to Unmarried Women
COMPARE
Immigrants from Bolivia
Mongolian
Births to Unmarried Women
Births to Unmarried Women Comparison
Immigrants from Bolivia
Mongolians
28.6%
BIRTHS TO UNMARRIED WOMEN
98.5/ 100
METRIC RATING
74th/ 347
METRIC RANK
27.9%
BIRTHS TO UNMARRIED WOMEN
99.3/ 100
METRIC RATING
55th/ 347
METRIC RANK
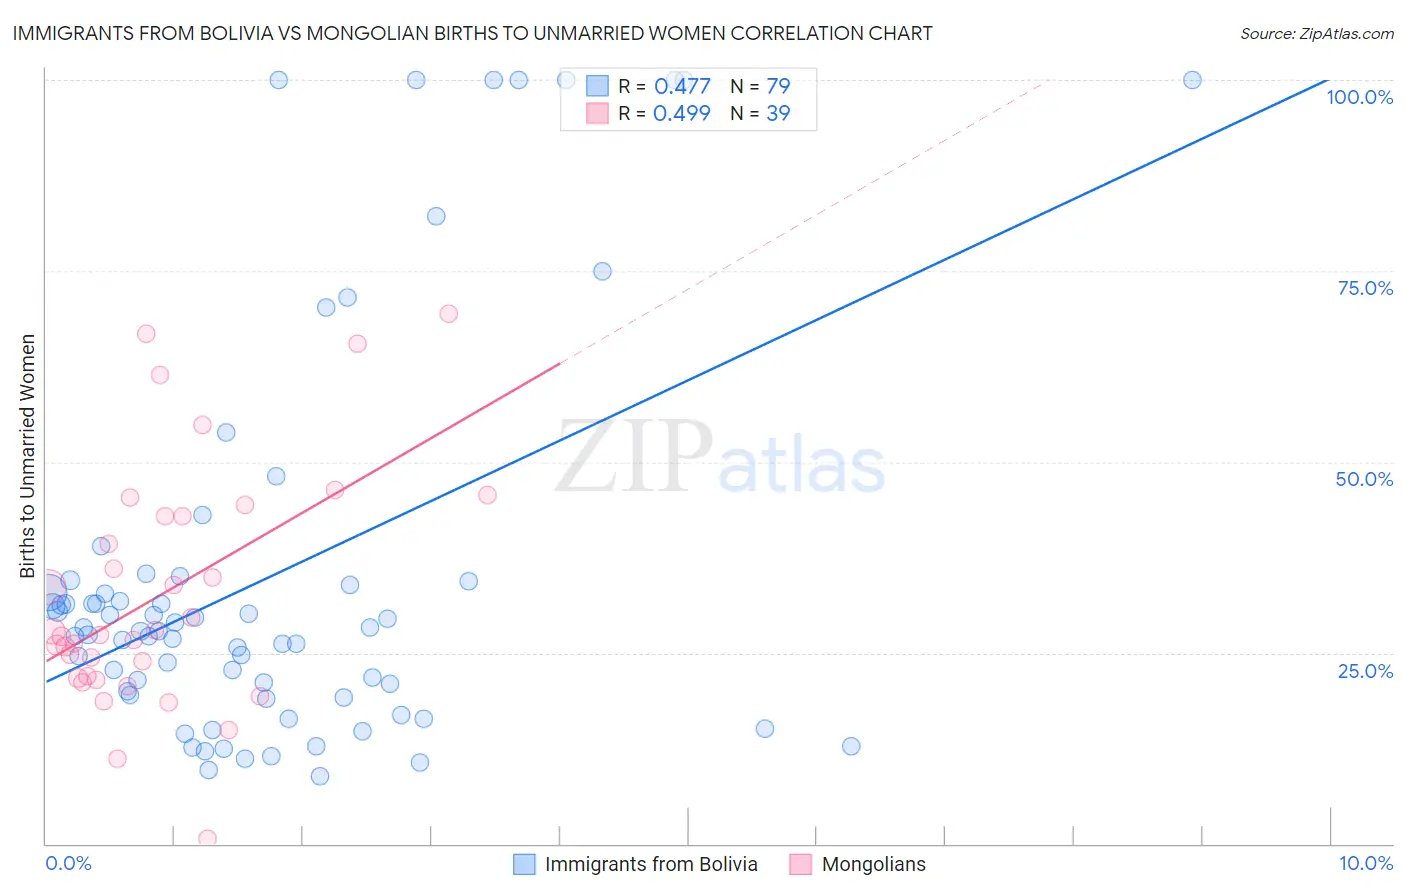
Immigrants from Bolivia vs Mongolian Births to Unmarried Women Correlation Chart
The statistical analysis conducted on geographies consisting of 153,801,306 people shows a moderate positive correlation between the proportion of Immigrants from Bolivia and percentage of births to unmarried women in the United States with a correlation coefficient (R) of 0.477 and weighted average of 28.6%. Similarly, the statistical analysis conducted on geographies consisting of 135,823,191 people shows a moderate positive correlation between the proportion of Mongolians and percentage of births to unmarried women in the United States with a correlation coefficient (R) of 0.499 and weighted average of 27.9%, a difference of 2.3%.
Births to Unmarried Women Correlation Summary
| Measurement | Immigrants from Bolivia | Mongolian |
| Minimum | 8.9% | 0.60% |
| Maximum | 100.0% | 69.4% |
| Range | 91.1% | 68.8% |
| Mean | 35.2% | 32.6% |
| Median | 27.9% | 27.3% |
| Interquartile 25% (IQ1) | 19.4% | 21.7% |
| Interquartile 75% (IQ3) | 34.4% | 42.9% |
| Interquartile Range (IQR) | 15.0% | 21.2% |
| Standard Deviation (Sample) | 25.9% | 15.7% |
| Standard Deviation (Population) | 25.8% | 15.5% |
Demographics Similar to Immigrants from Bolivia and Mongolians by Births to Unmarried Women
In terms of births to unmarried women, the demographic groups most similar to Immigrants from Bolivia are Albanian (28.5%, a difference of 0.020%), Immigrants from Sweden (28.5%, a difference of 0.070%), Jordanian (28.5%, a difference of 0.13%), Laotian (28.5%, a difference of 0.31%), and Bolivian (28.5%, a difference of 0.37%). Similarly, the demographic groups most similar to Mongolians are Afghan (27.9%, a difference of 0.040%), Immigrants from Belgium (28.0%, a difference of 0.26%), Russian (28.0%, a difference of 0.39%), Immigrants from Albania (28.0%, a difference of 0.50%), and Immigrants from Kazakhstan (28.1%, a difference of 0.76%).
| Demographics | Rating | Rank | Births to Unmarried Women |
| Afghans | 99.4 /100 | #54 | Exceptional 27.9% |
| Mongolians | 99.3 /100 | #55 | Exceptional 27.9% |
| Immigrants | Belgium | 99.3 /100 | #56 | Exceptional 28.0% |
| Russians | 99.2 /100 | #57 | Exceptional 28.0% |
| Immigrants | Albania | 99.2 /100 | #58 | Exceptional 28.0% |
| Immigrants | Kazakhstan | 99.1 /100 | #59 | Exceptional 28.1% |
| Immigrants | Turkey | 99.1 /100 | #60 | Exceptional 28.1% |
| Immigrants | North Macedonia | 99.1 /100 | #61 | Exceptional 28.1% |
| Egyptians | 99.0 /100 | #62 | Exceptional 28.2% |
| Immigrants | Serbia | 98.9 /100 | #63 | Exceptional 28.3% |
| Tongans | 98.8 /100 | #64 | Exceptional 28.4% |
| Immigrants | Czechoslovakia | 98.8 /100 | #65 | Exceptional 28.4% |
| Immigrants | Egypt | 98.8 /100 | #66 | Exceptional 28.4% |
| Palestinians | 98.7 /100 | #67 | Exceptional 28.4% |
| Immigrants | Europe | 98.7 /100 | #68 | Exceptional 28.4% |
| Bolivians | 98.7 /100 | #69 | Exceptional 28.5% |
| Laotians | 98.6 /100 | #70 | Exceptional 28.5% |
| Jordanians | 98.5 /100 | #71 | Exceptional 28.5% |
| Immigrants | Sweden | 98.5 /100 | #72 | Exceptional 28.5% |
| Albanians | 98.5 /100 | #73 | Exceptional 28.5% |
| Immigrants | Bolivia | 98.5 /100 | #74 | Exceptional 28.6% |