Immigrants from Belgium vs Haitian Currently Married
COMPARE
Immigrants from Belgium
Haitian
Currently Married
Currently Married Comparison
Immigrants from Belgium
Haitians
48.1%
CURRENTLY MARRIED
97.1/ 100
METRIC RATING
78th/ 347
METRIC RANK
41.3%
CURRENTLY MARRIED
0.0/ 100
METRIC RATING
317th/ 347
METRIC RANK
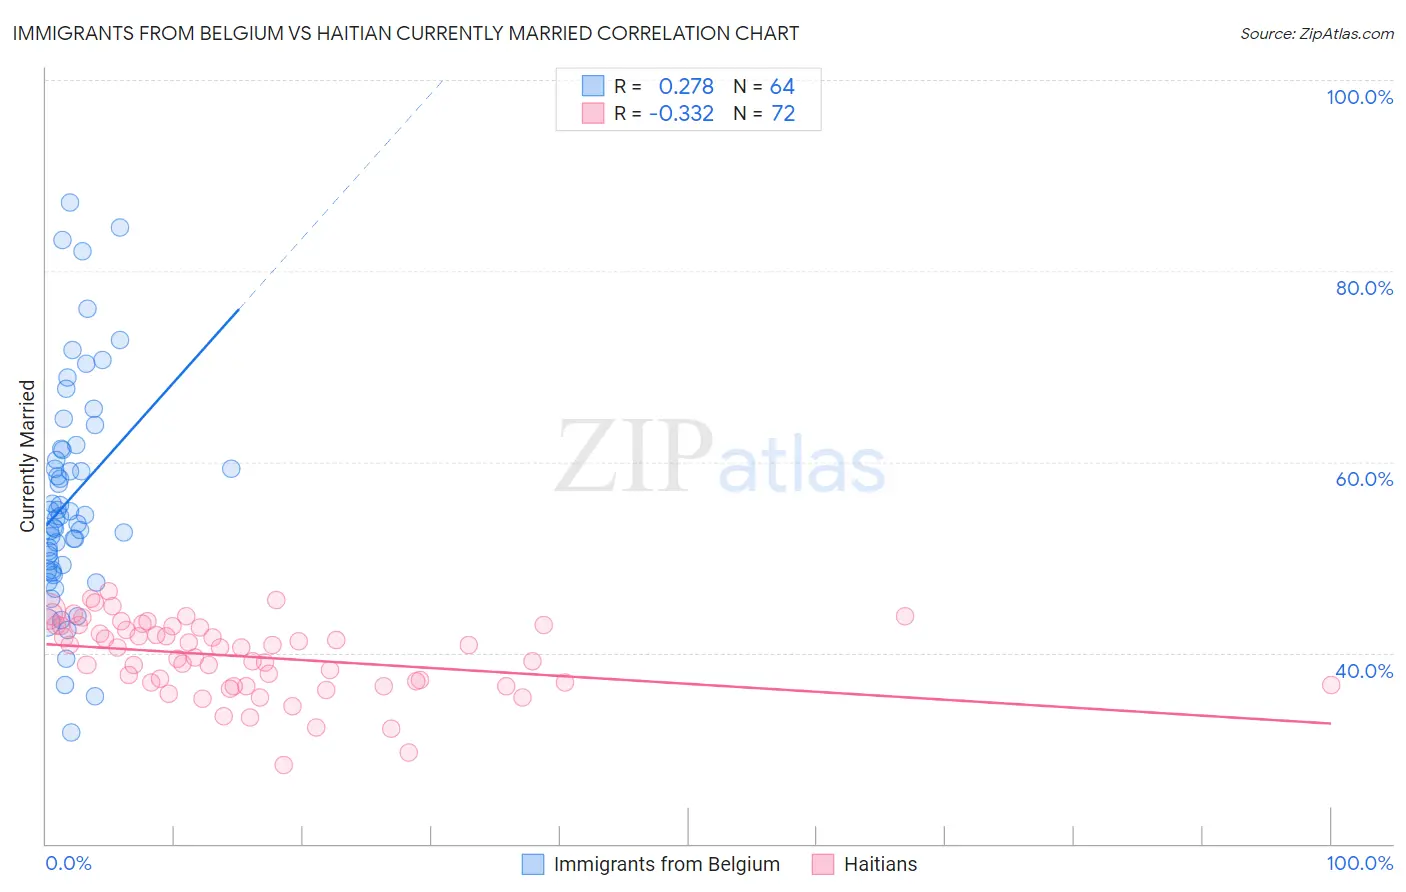
Immigrants from Belgium vs Haitian Currently Married Correlation Chart
The statistical analysis conducted on geographies consisting of 146,720,291 people shows a weak positive correlation between the proportion of Immigrants from Belgium and percentage of population currently married in the United States with a correlation coefficient (R) of 0.278 and weighted average of 48.1%. Similarly, the statistical analysis conducted on geographies consisting of 287,965,636 people shows a mild negative correlation between the proportion of Haitians and percentage of population currently married in the United States with a correlation coefficient (R) of -0.332 and weighted average of 41.3%, a difference of 16.7%.
Currently Married Correlation Summary
| Measurement | Immigrants from Belgium | Haitian |
| Minimum | 31.6% | 28.3% |
| Maximum | 87.2% | 46.5% |
| Range | 55.6% | 18.2% |
| Mean | 56.2% | 39.6% |
| Median | 54.1% | 40.6% |
| Interquartile 25% (IQ1) | 49.0% | 36.7% |
| Interquartile 75% (IQ3) | 61.3% | 42.8% |
| Interquartile Range (IQR) | 12.4% | 6.1% |
| Standard Deviation (Sample) | 11.6% | 3.9% |
| Standard Deviation (Population) | 11.5% | 3.9% |
Similar Demographics by Currently Married
Demographics Similar to Immigrants from Belgium by Currently Married
In terms of currently married, the demographic groups most similar to Immigrants from Belgium are Slovene (48.1%, a difference of 0.010%), Immigrants from South Africa (48.1%, a difference of 0.010%), Basque (48.1%, a difference of 0.030%), Immigrants from Poland (48.1%, a difference of 0.040%), and Immigrants from Belarus (48.1%, a difference of 0.050%).
| Demographics | Rating | Rank | Currently Married |
| Macedonians | 97.9 /100 | #71 | Exceptional 48.3% |
| Immigrants | Lebanon | 97.6 /100 | #72 | Exceptional 48.2% |
| Immigrants | Eastern Asia | 97.5 /100 | #73 | Exceptional 48.2% |
| Estonians | 97.4 /100 | #74 | Exceptional 48.2% |
| Immigrants | Belarus | 97.2 /100 | #75 | Exceptional 48.1% |
| Basques | 97.2 /100 | #76 | Exceptional 48.1% |
| Slovenes | 97.1 /100 | #77 | Exceptional 48.1% |
| Immigrants | Belgium | 97.1 /100 | #78 | Exceptional 48.1% |
| Immigrants | South Africa | 97.0 /100 | #79 | Exceptional 48.1% |
| Immigrants | Poland | 96.9 /100 | #80 | Exceptional 48.1% |
| Immigrants | Sri Lanka | 96.9 /100 | #81 | Exceptional 48.1% |
| Immigrants | Europe | 96.9 /100 | #82 | Exceptional 48.1% |
| Bolivians | 96.9 /100 | #83 | Exceptional 48.1% |
| Immigrants | Israel | 96.9 /100 | #84 | Exceptional 48.1% |
| French Canadians | 96.3 /100 | #85 | Exceptional 48.0% |
Demographics Similar to Haitians by Currently Married
In terms of currently married, the demographic groups most similar to Haitians are Immigrants from Caribbean (41.3%, a difference of 0.020%), Inupiat (41.3%, a difference of 0.080%), West Indian (41.3%, a difference of 0.17%), Bahamian (41.2%, a difference of 0.18%), and Immigrants from Somalia (41.2%, a difference of 0.20%).
| Demographics | Rating | Rank | Currently Married |
| Guyanese | 0.0 /100 | #310 | Tragic 41.6% |
| Trinidadians and Tobagonians | 0.0 /100 | #311 | Tragic 41.5% |
| Somalis | 0.0 /100 | #312 | Tragic 41.5% |
| Jamaicans | 0.0 /100 | #313 | Tragic 41.4% |
| West Indians | 0.0 /100 | #314 | Tragic 41.3% |
| Inupiat | 0.0 /100 | #315 | Tragic 41.3% |
| Immigrants | Caribbean | 0.0 /100 | #316 | Tragic 41.3% |
| Haitians | 0.0 /100 | #317 | Tragic 41.3% |
| Bahamians | 0.0 /100 | #318 | Tragic 41.2% |
| Immigrants | Somalia | 0.0 /100 | #319 | Tragic 41.2% |
| Immigrants | Jamaica | 0.0 /100 | #320 | Tragic 41.1% |
| Immigrants | Congo | 0.0 /100 | #321 | Tragic 41.1% |
| Immigrants | Haiti | 0.0 /100 | #322 | Tragic 41.0% |
| Immigrants | West Indies | 0.0 /100 | #323 | Tragic 40.7% |
| Immigrants | Senegal | 0.0 /100 | #324 | Tragic 40.7% |