Immigrants from Barbados vs Polish Divorced or Separated
COMPARE
Immigrants from Barbados
Polish
Divorced or Separated
Divorced or Separated Comparison
Immigrants from Barbados
Poles
12.0%
DIVORCED OR SEPARATED
66.0/ 100
METRIC RATING
159th/ 347
METRIC RANK
11.9%
DIVORCED OR SEPARATED
78.6/ 100
METRIC RATING
147th/ 347
METRIC RANK
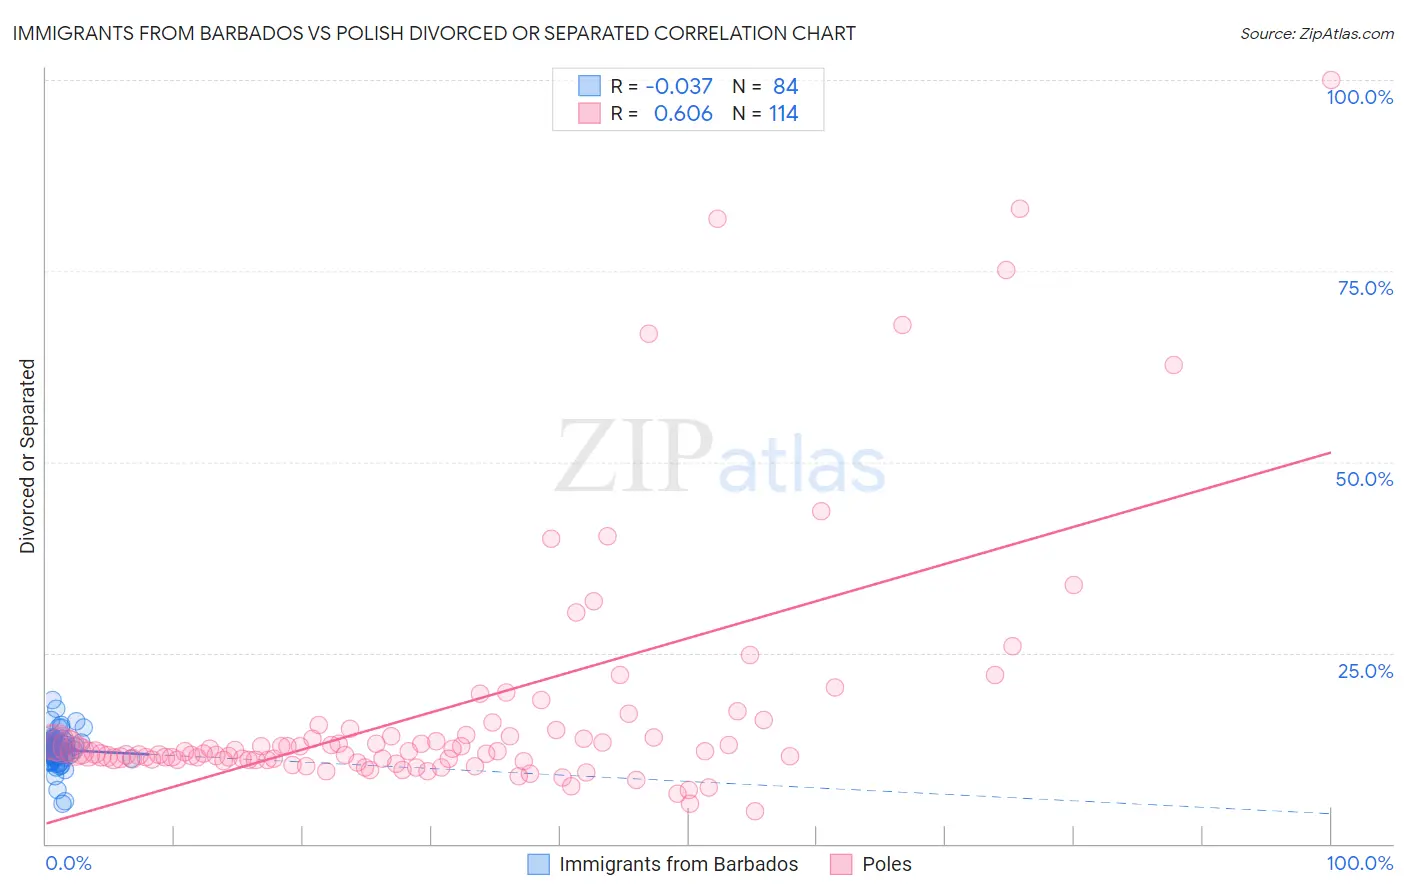
Immigrants from Barbados vs Polish Divorced or Separated Correlation Chart
The statistical analysis conducted on geographies consisting of 112,765,917 people shows no correlation between the proportion of Immigrants from Barbados and percentage of population currently divorced or separated in the United States with a correlation coefficient (R) of -0.037 and weighted average of 12.0%. Similarly, the statistical analysis conducted on geographies consisting of 560,123,117 people shows a significant positive correlation between the proportion of Poles and percentage of population currently divorced or separated in the United States with a correlation coefficient (R) of 0.606 and weighted average of 11.9%, a difference of 0.56%.
Divorced or Separated Correlation Summary
| Measurement | Immigrants from Barbados | Polish |
| Minimum | 5.3% | 4.3% |
| Maximum | 18.9% | 100.0% |
| Range | 13.6% | 95.7% |
| Mean | 12.3% | 17.6% |
| Median | 12.4% | 12.1% |
| Interquartile 25% (IQ1) | 11.4% | 11.0% |
| Interquartile 75% (IQ3) | 13.1% | 14.3% |
| Interquartile Range (IQR) | 1.6% | 3.2% |
| Standard Deviation (Sample) | 2.0% | 16.8% |
| Standard Deviation (Population) | 2.0% | 16.7% |
Demographics Similar to Immigrants from Barbados and Poles by Divorced or Separated
In terms of divorced or separated, the demographic groups most similar to Immigrants from Barbados are Icelander (12.0%, a difference of 0.0%), Immigrants from Scotland (12.0%, a difference of 0.010%), Marshallese (12.0%, a difference of 0.050%), Samoan (12.0%, a difference of 0.070%), and Navajo (12.0%, a difference of 0.080%). Similarly, the demographic groups most similar to Poles are Immigrants from Grenada (11.9%, a difference of 0.030%), Italian (11.9%, a difference of 0.040%), Immigrants from Oceania (11.9%, a difference of 0.050%), Immigrants from Portugal (11.9%, a difference of 0.070%), and Croatian (11.9%, a difference of 0.11%).
| Demographics | Rating | Rank | Divorced or Separated |
| Pakistanis | 81.3 /100 | #143 | Excellent 11.9% |
| Peruvians | 80.9 /100 | #144 | Excellent 11.9% |
| Croatians | 80.6 /100 | #145 | Excellent 11.9% |
| Immigrants | Grenada | 79.1 /100 | #146 | Good 11.9% |
| Poles | 78.6 /100 | #147 | Good 11.9% |
| Italians | 77.8 /100 | #148 | Good 11.9% |
| Immigrants | Oceania | 77.7 /100 | #149 | Good 11.9% |
| Immigrants | Portugal | 77.3 /100 | #150 | Good 11.9% |
| Czechs | 76.4 /100 | #151 | Good 11.9% |
| Immigrants | Hungary | 73.7 /100 | #152 | Good 11.9% |
| Austrians | 72.2 /100 | #153 | Good 12.0% |
| Chileans | 71.3 /100 | #154 | Good 12.0% |
| Japanese | 70.9 /100 | #155 | Good 12.0% |
| Hungarians | 70.3 /100 | #156 | Good 12.0% |
| Immigrants | Brazil | 68.8 /100 | #157 | Good 12.0% |
| Icelanders | 66.0 /100 | #158 | Good 12.0% |
| Immigrants | Barbados | 66.0 /100 | #159 | Good 12.0% |
| Immigrants | Scotland | 65.8 /100 | #160 | Good 12.0% |
| Marshallese | 64.6 /100 | #161 | Good 12.0% |
| Samoans | 64.3 /100 | #162 | Good 12.0% |
| Navajo | 63.9 /100 | #163 | Good 12.0% |