Immigrants from Barbados vs Immigrants from Turkey Currently Married
COMPARE
Immigrants from Barbados
Immigrants from Turkey
Currently Married
Currently Married Comparison
Immigrants from Barbados
Immigrants from Turkey
40.3%
CURRENTLY MARRIED
0.0/ 100
METRIC RATING
331st/ 347
METRIC RANK
47.0%
CURRENTLY MARRIED
70.0/ 100
METRIC RATING
150th/ 347
METRIC RANK
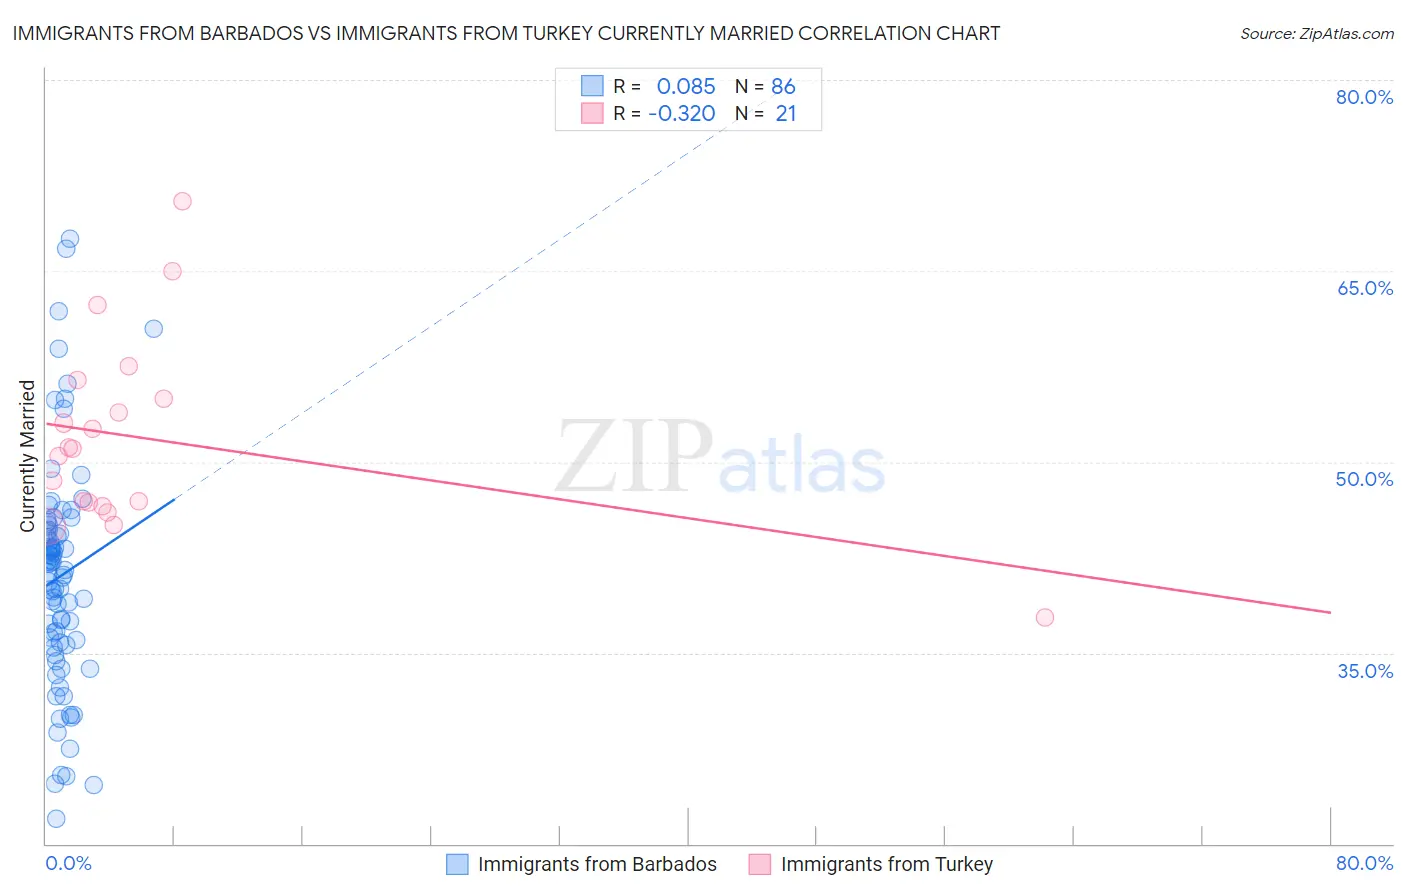
Immigrants from Barbados vs Immigrants from Turkey Currently Married Correlation Chart
The statistical analysis conducted on geographies consisting of 112,780,332 people shows a slight positive correlation between the proportion of Immigrants from Barbados and percentage of population currently married in the United States with a correlation coefficient (R) of 0.085 and weighted average of 40.3%. Similarly, the statistical analysis conducted on geographies consisting of 223,037,239 people shows a mild negative correlation between the proportion of Immigrants from Turkey and percentage of population currently married in the United States with a correlation coefficient (R) of -0.320 and weighted average of 47.0%, a difference of 16.5%.
Currently Married Correlation Summary
| Measurement | Immigrants from Barbados | Immigrants from Turkey |
| Minimum | 22.0% | 37.8% |
| Maximum | 67.5% | 70.5% |
| Range | 45.5% | 32.7% |
| Mean | 41.0% | 51.8% |
| Median | 41.3% | 51.0% |
| Interquartile 25% (IQ1) | 35.8% | 46.7% |
| Interquartile 75% (IQ3) | 44.6% | 55.7% |
| Interquartile Range (IQR) | 8.9% | 9.0% |
| Standard Deviation (Sample) | 8.9% | 7.6% |
| Standard Deviation (Population) | 8.9% | 7.4% |
Similar Demographics by Currently Married
Demographics Similar to Immigrants from Barbados by Currently Married
In terms of currently married, the demographic groups most similar to Immigrants from Barbados are Immigrants from Dominica (40.3%, a difference of 0.020%), Crow (40.4%, a difference of 0.10%), Arapaho (40.5%, a difference of 0.53%), Senegalese (40.6%, a difference of 0.58%), and Immigrants from St. Vincent and the Grenadines (40.1%, a difference of 0.67%).
| Demographics | Rating | Rank | Currently Married |
| Immigrants | Senegal | 0.0 /100 | #324 | Tragic 40.7% |
| U.S. Virgin Islanders | 0.0 /100 | #325 | Tragic 40.7% |
| Barbadians | 0.0 /100 | #326 | Tragic 40.6% |
| Senegalese | 0.0 /100 | #327 | Tragic 40.6% |
| Arapaho | 0.0 /100 | #328 | Tragic 40.5% |
| Crow | 0.0 /100 | #329 | Tragic 40.4% |
| Immigrants | Dominica | 0.0 /100 | #330 | Tragic 40.3% |
| Immigrants | Barbados | 0.0 /100 | #331 | Tragic 40.3% |
| Immigrants | St. Vincent and the Grenadines | 0.0 /100 | #332 | Tragic 40.1% |
| Yup'ik | 0.0 /100 | #333 | Tragic 39.9% |
| Puerto Ricans | 0.0 /100 | #334 | Tragic 39.9% |
| Lumbee | 0.0 /100 | #335 | Tragic 39.8% |
| British West Indians | 0.0 /100 | #336 | Tragic 39.8% |
| Blacks/African Americans | 0.0 /100 | #337 | Tragic 39.6% |
| Cape Verdeans | 0.0 /100 | #338 | Tragic 39.6% |
Demographics Similar to Immigrants from Turkey by Currently Married
In terms of currently married, the demographic groups most similar to Immigrants from Turkey are Zimbabwean (47.0%, a difference of 0.0%), Cambodian (47.0%, a difference of 0.010%), Chilean (47.0%, a difference of 0.010%), Immigrants from Serbia (47.0%, a difference of 0.050%), and Immigrants from Venezuela (47.0%, a difference of 0.060%).
| Demographics | Rating | Rank | Currently Married |
| Guamanians/Chamorros | 74.2 /100 | #143 | Good 47.1% |
| Hmong | 73.4 /100 | #144 | Good 47.1% |
| Immigrants | South Eastern Asia | 72.9 /100 | #145 | Good 47.1% |
| Carpatho Rusyns | 72.6 /100 | #146 | Good 47.0% |
| Immigrants | Argentina | 72.0 /100 | #147 | Good 47.0% |
| Cambodians | 70.4 /100 | #148 | Good 47.0% |
| Zimbabweans | 70.1 /100 | #149 | Good 47.0% |
| Immigrants | Turkey | 70.0 /100 | #150 | Good 47.0% |
| Chileans | 69.8 /100 | #151 | Good 47.0% |
| Immigrants | Serbia | 68.8 /100 | #152 | Good 47.0% |
| Immigrants | Venezuela | 68.6 /100 | #153 | Good 47.0% |
| Albanians | 68.6 /100 | #154 | Good 47.0% |
| Arabs | 68.6 /100 | #155 | Good 47.0% |
| Spanish | 68.1 /100 | #156 | Good 47.0% |
| Immigrants | Switzerland | 67.8 /100 | #157 | Good 46.9% |