Immigrants from Barbados vs Immigrants from Ecuador Single Father Households
COMPARE
Immigrants from Barbados
Immigrants from Ecuador
Single Father Households
Single Father Households Comparison
Immigrants from Barbados
Immigrants from Ecuador
2.2%
SINGLE FATHER HOUSEHOLDS
98.2/ 100
METRIC RATING
115th/ 347
METRIC RANK
2.4%
SINGLE FATHER HOUSEHOLDS
14.9/ 100
METRIC RATING
216th/ 347
METRIC RANK
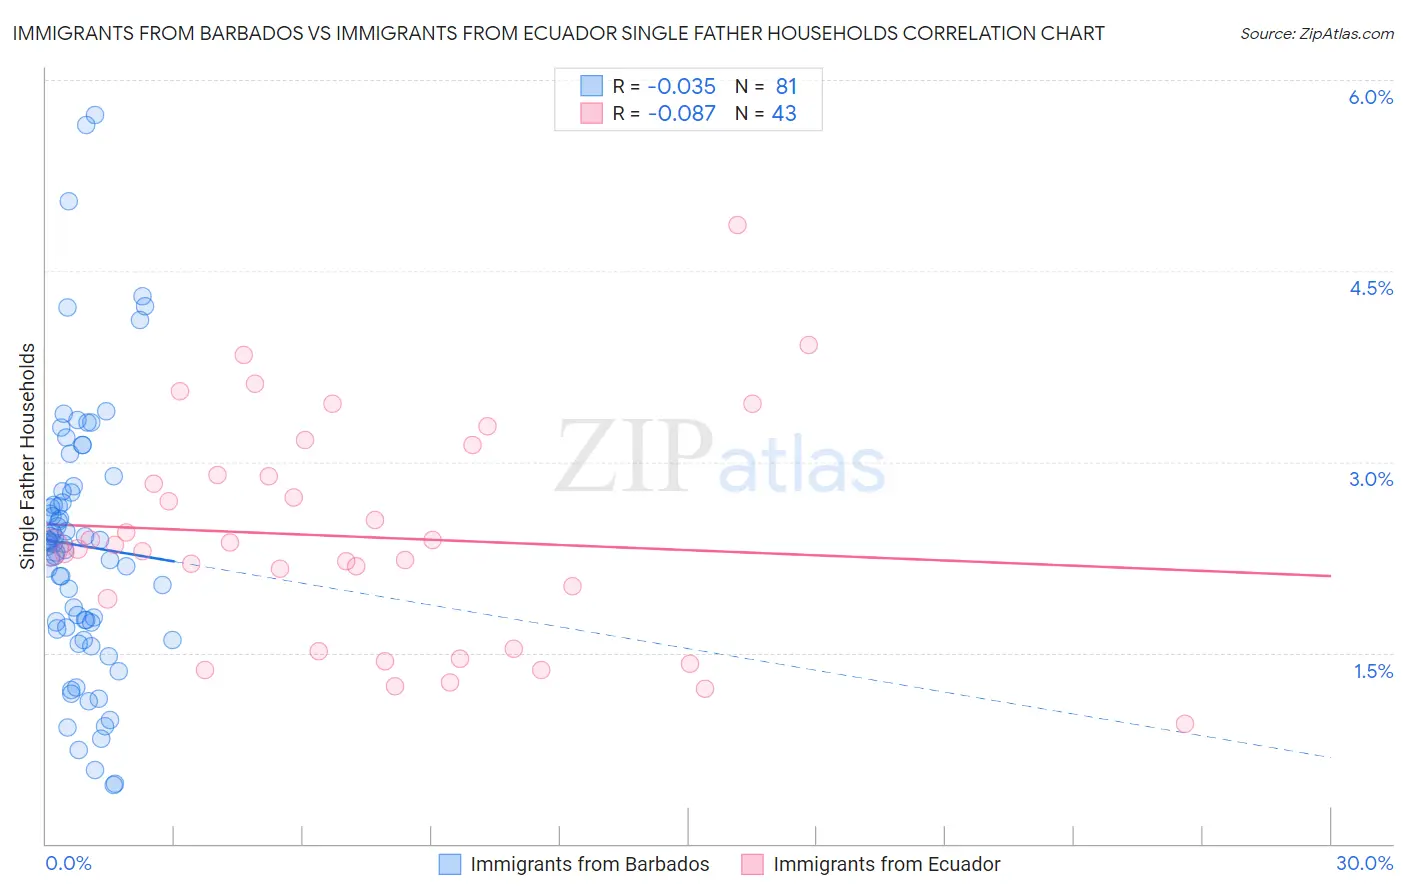
Immigrants from Barbados vs Immigrants from Ecuador Single Father Households Correlation Chart
The statistical analysis conducted on geographies consisting of 112,598,032 people shows no correlation between the proportion of Immigrants from Barbados and percentage of single father households in the United States with a correlation coefficient (R) of -0.035 and weighted average of 2.2%. Similarly, the statistical analysis conducted on geographies consisting of 269,379,294 people shows a slight negative correlation between the proportion of Immigrants from Ecuador and percentage of single father households in the United States with a correlation coefficient (R) of -0.087 and weighted average of 2.4%, a difference of 11.3%.
Single Father Households Correlation Summary
| Measurement | Immigrants from Barbados | Immigrants from Ecuador |
| Minimum | 0.46% | 0.94% |
| Maximum | 5.7% | 4.9% |
| Range | 5.3% | 3.9% |
| Mean | 2.3% | 2.4% |
| Median | 2.4% | 2.3% |
| Interquartile 25% (IQ1) | 1.7% | 1.5% |
| Interquartile 75% (IQ3) | 2.8% | 2.9% |
| Interquartile Range (IQR) | 1.1% | 1.4% |
| Standard Deviation (Sample) | 1.1% | 0.87% |
| Standard Deviation (Population) | 1.0% | 0.86% |
Similar Demographics by Single Father Households
Demographics Similar to Immigrants from Barbados by Single Father Households
In terms of single father households, the demographic groups most similar to Immigrants from Barbados are Immigrants from North America (2.2%, a difference of 0.030%), Immigrants from Argentina (2.2%, a difference of 0.030%), Iraqi (2.2%, a difference of 0.070%), Immigrants from Trinidad and Tobago (2.2%, a difference of 0.090%), and Immigrants from Canada (2.2%, a difference of 0.12%).
| Demographics | Rating | Rank | Single Father Households |
| Immigrants | Netherlands | 98.5 /100 | #108 | Exceptional 2.2% |
| Barbadians | 98.4 /100 | #109 | Exceptional 2.2% |
| Italians | 98.3 /100 | #110 | Exceptional 2.2% |
| Immigrants | Canada | 98.3 /100 | #111 | Exceptional 2.2% |
| Immigrants | Trinidad and Tobago | 98.2 /100 | #112 | Exceptional 2.2% |
| Iraqis | 98.2 /100 | #113 | Exceptional 2.2% |
| Immigrants | North America | 98.2 /100 | #114 | Exceptional 2.2% |
| Immigrants | Barbados | 98.2 /100 | #115 | Exceptional 2.2% |
| Immigrants | Argentina | 98.1 /100 | #116 | Exceptional 2.2% |
| Hungarians | 97.9 /100 | #117 | Exceptional 2.2% |
| Immigrants | Morocco | 97.8 /100 | #118 | Exceptional 2.2% |
| Trinidadians and Tobagonians | 97.8 /100 | #119 | Exceptional 2.2% |
| Australians | 97.7 /100 | #120 | Exceptional 2.2% |
| Immigrants | Brazil | 97.7 /100 | #121 | Exceptional 2.2% |
| Immigrants | Iraq | 97.6 /100 | #122 | Exceptional 2.2% |
Demographics Similar to Immigrants from Ecuador by Single Father Households
In terms of single father households, the demographic groups most similar to Immigrants from Ecuador are Dutch (2.4%, a difference of 0.090%), Immigrants from South Eastern Asia (2.4%, a difference of 0.13%), Immigrants from Ethiopia (2.4%, a difference of 0.22%), Ethiopian (2.4%, a difference of 0.23%), and Norwegian (2.4%, a difference of 0.29%).
| Demographics | Rating | Rank | Single Father Households |
| Immigrants | Peru | 19.3 /100 | #209 | Poor 2.4% |
| Immigrants | Costa Rica | 19.2 /100 | #210 | Poor 2.4% |
| Immigrants | Nigeria | 18.7 /100 | #211 | Poor 2.4% |
| Finns | 18.3 /100 | #212 | Poor 2.4% |
| Norwegians | 17.1 /100 | #213 | Poor 2.4% |
| Ethiopians | 16.6 /100 | #214 | Poor 2.4% |
| Immigrants | South Eastern Asia | 15.9 /100 | #215 | Poor 2.4% |
| Immigrants | Ecuador | 14.9 /100 | #216 | Poor 2.4% |
| Dutch | 14.3 /100 | #217 | Poor 2.4% |
| Immigrants | Ethiopia | 13.4 /100 | #218 | Poor 2.4% |
| Sudanese | 13.0 /100 | #219 | Poor 2.4% |
| Ghanaians | 12.9 /100 | #220 | Poor 2.4% |
| Immigrants | Burma/Myanmar | 12.1 /100 | #221 | Poor 2.4% |
| Immigrants | Eastern Africa | 11.9 /100 | #222 | Poor 2.4% |
| Immigrants | Uruguay | 11.0 /100 | #223 | Poor 2.4% |