Immigrants from Barbados vs Bulgarian Single Mother Households
COMPARE
Immigrants from Barbados
Bulgarian
Single Mother Households
Single Mother Households Comparison
Immigrants from Barbados
Bulgarians
8.0%
SINGLE MOTHER HOUSEHOLDS
0.0/ 100
METRIC RATING
306th/ 347
METRIC RANK
5.3%
SINGLE MOTHER HOUSEHOLDS
99.7/ 100
METRIC RATING
34th/ 347
METRIC RANK
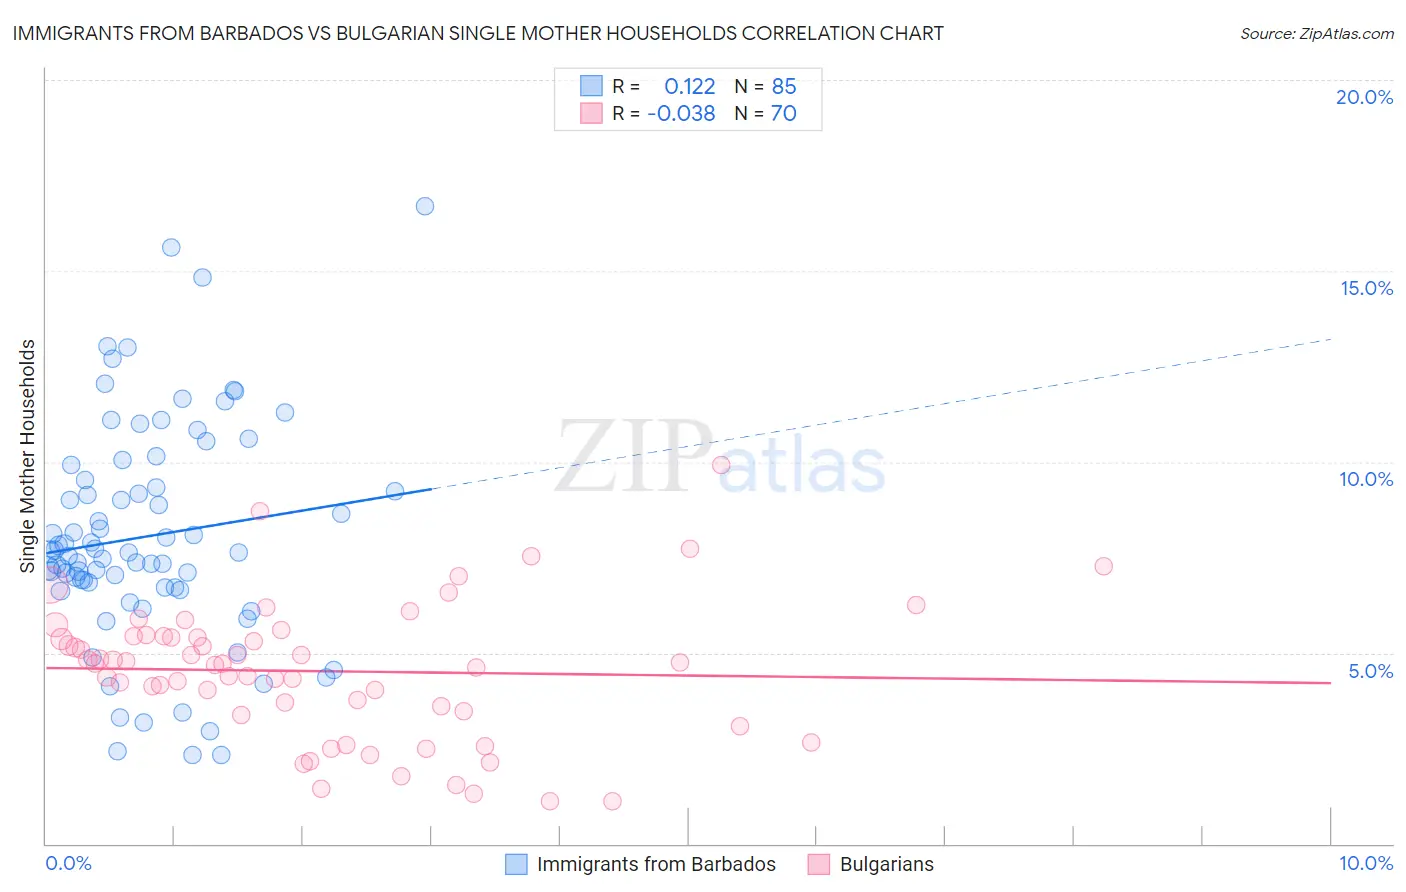
Immigrants from Barbados vs Bulgarian Single Mother Households Correlation Chart
The statistical analysis conducted on geographies consisting of 112,754,118 people shows a poor positive correlation between the proportion of Immigrants from Barbados and percentage of single mother households in the United States with a correlation coefficient (R) of 0.122 and weighted average of 8.0%. Similarly, the statistical analysis conducted on geographies consisting of 205,286,227 people shows no correlation between the proportion of Bulgarians and percentage of single mother households in the United States with a correlation coefficient (R) of -0.038 and weighted average of 5.3%, a difference of 51.2%.
Single Mother Households Correlation Summary
| Measurement | Immigrants from Barbados | Bulgarian |
| Minimum | 2.3% | 1.1% |
| Maximum | 16.7% | 9.9% |
| Range | 14.4% | 8.8% |
| Mean | 8.1% | 4.5% |
| Median | 7.6% | 4.7% |
| Interquartile 25% (IQ1) | 6.7% | 3.5% |
| Interquartile 75% (IQ3) | 9.7% | 5.4% |
| Interquartile Range (IQR) | 3.0% | 1.9% |
| Standard Deviation (Sample) | 2.9% | 1.8% |
| Standard Deviation (Population) | 2.9% | 1.8% |
Similar Demographics by Single Mother Households
Demographics Similar to Immigrants from Barbados by Single Mother Households
In terms of single mother households, the demographic groups most similar to Immigrants from Barbados are Colville (8.0%, a difference of 0.070%), Native/Alaskan (8.0%, a difference of 0.12%), Immigrants from St. Vincent and the Grenadines (8.0%, a difference of 0.24%), Immigrants from Central America (8.1%, a difference of 0.26%), and Immigrants from Bahamas (8.0%, a difference of 0.56%).
| Demographics | Rating | Rank | Single Mother Households |
| Houma | 0.0 /100 | #299 | Tragic 7.9% |
| Mexicans | 0.0 /100 | #300 | Tragic 8.0% |
| Chippewa | 0.0 /100 | #301 | Tragic 8.0% |
| Immigrants | Ghana | 0.0 /100 | #302 | Tragic 8.0% |
| Immigrants | Bahamas | 0.0 /100 | #303 | Tragic 8.0% |
| Natives/Alaskans | 0.0 /100 | #304 | Tragic 8.0% |
| Colville | 0.0 /100 | #305 | Tragic 8.0% |
| Immigrants | Barbados | 0.0 /100 | #306 | Tragic 8.0% |
| Immigrants | St. Vincent and the Grenadines | 0.0 /100 | #307 | Tragic 8.0% |
| Immigrants | Central America | 0.0 /100 | #308 | Tragic 8.1% |
| Cheyenne | 0.0 /100 | #309 | Tragic 8.1% |
| Hondurans | 0.0 /100 | #310 | Tragic 8.1% |
| Immigrants | Congo | 0.0 /100 | #311 | Tragic 8.1% |
| Bangladeshis | 0.0 /100 | #312 | Tragic 8.1% |
| Immigrants | Grenada | 0.0 /100 | #313 | Tragic 8.2% |
Demographics Similar to Bulgarians by Single Mother Households
In terms of single mother households, the demographic groups most similar to Bulgarians are Immigrants from Switzerland (5.3%, a difference of 0.020%), Immigrants from Northern Europe (5.3%, a difference of 0.040%), Immigrants from Czechoslovakia (5.3%, a difference of 0.24%), Immigrants from Belgium (5.3%, a difference of 0.38%), and Immigrants from Korea (5.3%, a difference of 0.41%).
| Demographics | Rating | Rank | Single Mother Households |
| Bhutanese | 99.7 /100 | #27 | Exceptional 5.3% |
| Russians | 99.7 /100 | #28 | Exceptional 5.3% |
| Latvians | 99.7 /100 | #29 | Exceptional 5.3% |
| Burmese | 99.7 /100 | #30 | Exceptional 5.3% |
| Immigrants | Korea | 99.7 /100 | #31 | Exceptional 5.3% |
| Cambodians | 99.7 /100 | #32 | Exceptional 5.3% |
| Immigrants | Switzerland | 99.7 /100 | #33 | Exceptional 5.3% |
| Bulgarians | 99.7 /100 | #34 | Exceptional 5.3% |
| Immigrants | Northern Europe | 99.7 /100 | #35 | Exceptional 5.3% |
| Immigrants | Czechoslovakia | 99.7 /100 | #36 | Exceptional 5.3% |
| Immigrants | Belgium | 99.7 /100 | #37 | Exceptional 5.3% |
| Immigrants | Serbia | 99.6 /100 | #38 | Exceptional 5.4% |
| Immigrants | Sweden | 99.6 /100 | #39 | Exceptional 5.4% |
| Estonians | 99.6 /100 | #40 | Exceptional 5.4% |
| Immigrants | Greece | 99.5 /100 | #41 | Exceptional 5.4% |