Immigrants from the Azores vs Ute Single Father Households
COMPARE
Immigrants from the Azores
Ute
Single Father Households
Single Father Households Comparison
Immigrants from the Azores
Ute
2.8%
SINGLE FATHER HOUSEHOLDS
0.0/ 100
METRIC RATING
306th/ 347
METRIC RANK
3.0%
SINGLE FATHER HOUSEHOLDS
0.0/ 100
METRIC RATING
319th/ 347
METRIC RANK
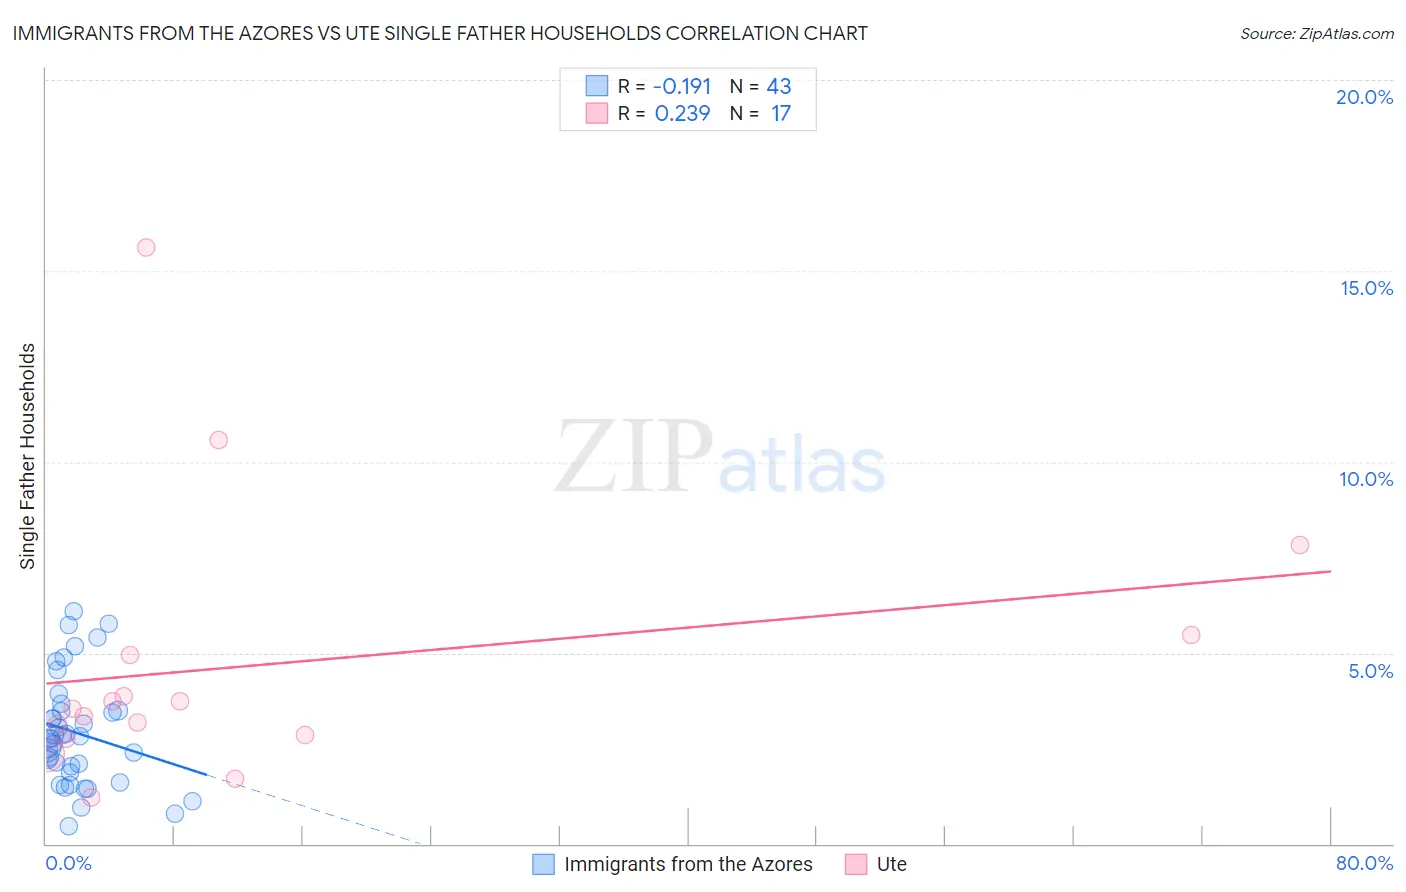
Immigrants from the Azores vs Ute Single Father Households Correlation Chart
The statistical analysis conducted on geographies consisting of 46,035,225 people shows a poor negative correlation between the proportion of Immigrants from the Azores and percentage of single father households in the United States with a correlation coefficient (R) of -0.191 and weighted average of 2.8%. Similarly, the statistical analysis conducted on geographies consisting of 55,604,261 people shows a weak positive correlation between the proportion of Ute and percentage of single father households in the United States with a correlation coefficient (R) of 0.239 and weighted average of 3.0%, a difference of 4.9%.
Single Father Households Correlation Summary
| Measurement | Immigrants from the Azores | Ute |
| Minimum | 0.46% | 1.2% |
| Maximum | 6.1% | 15.6% |
| Range | 5.6% | 14.4% |
| Mean | 2.9% | 4.7% |
| Median | 2.8% | 3.5% |
| Interquartile 25% (IQ1) | 1.9% | 2.8% |
| Interquartile 75% (IQ3) | 3.5% | 5.2% |
| Interquartile Range (IQR) | 1.6% | 2.4% |
| Standard Deviation (Sample) | 1.4% | 3.6% |
| Standard Deviation (Population) | 1.4% | 3.5% |
Demographics Similar to Immigrants from the Azores and Ute by Single Father Households
In terms of single father households, the demographic groups most similar to Immigrants from the Azores are Hispanic or Latino (2.8%, a difference of 0.16%), Hopi (2.8%, a difference of 0.17%), Mexican American Indian (2.8%, a difference of 0.31%), Apache (2.8%, a difference of 0.35%), and Immigrants from Honduras (2.8%, a difference of 0.63%). Similarly, the demographic groups most similar to Ute are Guatemalan (3.0%, a difference of 0.080%), Mexican (3.0%, a difference of 0.47%), Cape Verdean (2.9%, a difference of 0.53%), Immigrants from El Salvador (2.9%, a difference of 0.54%), and Immigrants from Guatemala (3.0%, a difference of 1.0%).
| Demographics | Rating | Rank | Single Father Households |
| Spanish Americans | 0.0 /100 | #302 | Tragic 2.8% |
| Immigrants | Honduras | 0.0 /100 | #303 | Tragic 2.8% |
| Mexican American Indians | 0.0 /100 | #304 | Tragic 2.8% |
| Hispanics or Latinos | 0.0 /100 | #305 | Tragic 2.8% |
| Immigrants | Azores | 0.0 /100 | #306 | Tragic 2.8% |
| Hopi | 0.0 /100 | #307 | Tragic 2.8% |
| Apache | 0.0 /100 | #308 | Tragic 2.8% |
| Central Americans | 0.0 /100 | #309 | Tragic 2.9% |
| Immigrants | Laos | 0.0 /100 | #310 | Tragic 2.9% |
| Spanish American Indians | 0.0 /100 | #311 | Tragic 2.9% |
| Tsimshian | 0.0 /100 | #312 | Tragic 2.9% |
| Arapaho | 0.0 /100 | #313 | Tragic 2.9% |
| Salvadorans | 0.0 /100 | #314 | Tragic 2.9% |
| Cheyenne | 0.0 /100 | #315 | Tragic 2.9% |
| Houma | 0.0 /100 | #316 | Tragic 2.9% |
| Immigrants | El Salvador | 0.0 /100 | #317 | Tragic 2.9% |
| Cape Verdeans | 0.0 /100 | #318 | Tragic 2.9% |
| Ute | 0.0 /100 | #319 | Tragic 3.0% |
| Guatemalans | 0.0 /100 | #320 | Tragic 3.0% |
| Mexicans | 0.0 /100 | #321 | Tragic 3.0% |
| Immigrants | Guatemala | 0.0 /100 | #322 | Tragic 3.0% |