Immigrants from Austria vs Alaskan Athabascan Divorced or Separated
COMPARE
Immigrants from Austria
Alaskan Athabascan
Divorced or Separated
Divorced or Separated Comparison
Immigrants from Austria
Alaskan Athabascans
11.8%
DIVORCED OR SEPARATED
88.2/ 100
METRIC RATING
130th/ 347
METRIC RANK
13.1%
DIVORCED OR SEPARATED
0.0/ 100
METRIC RATING
301st/ 347
METRIC RANK
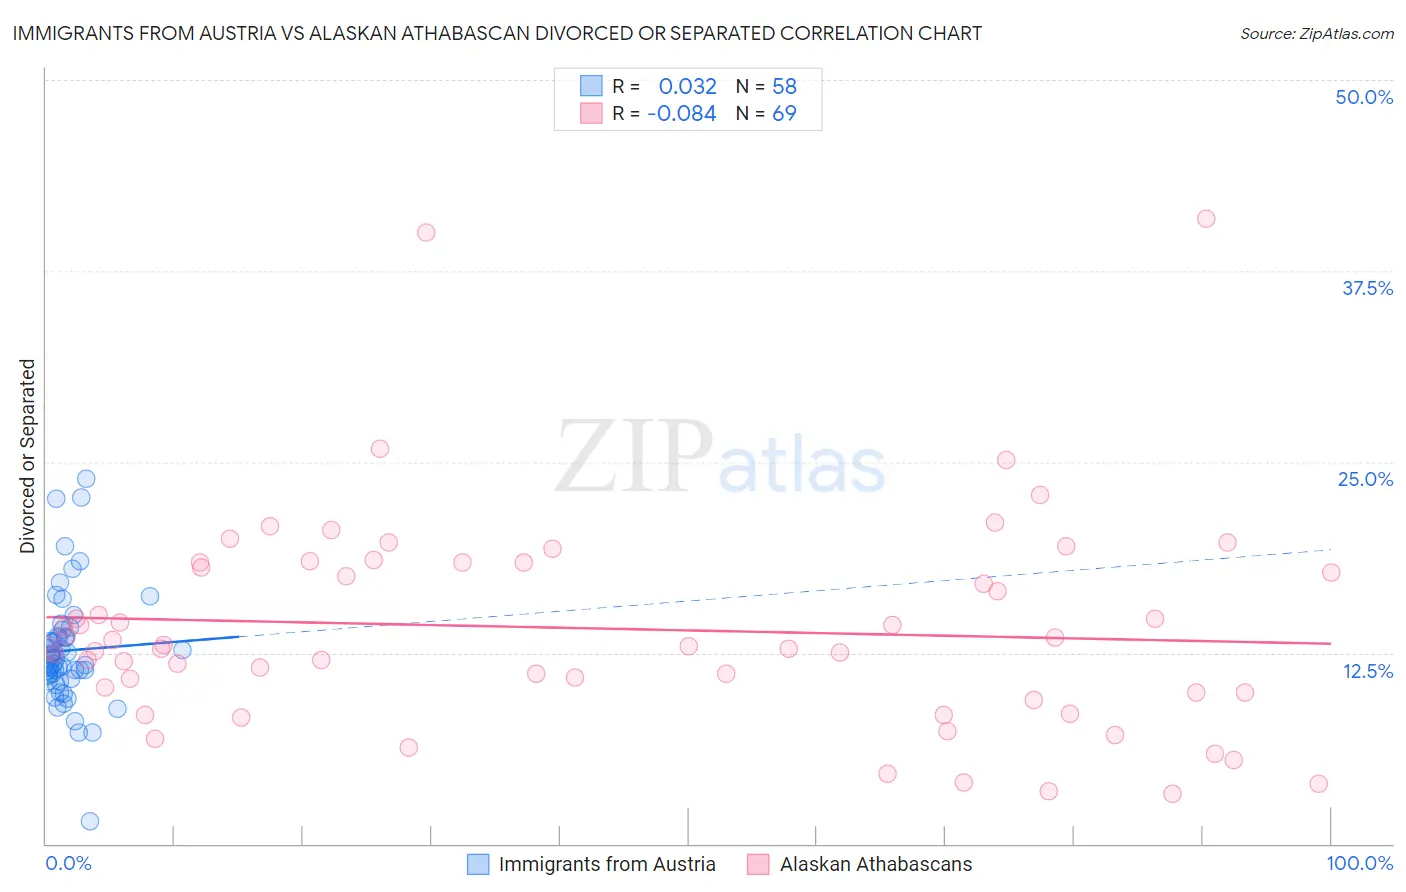
Immigrants from Austria vs Alaskan Athabascan Divorced or Separated Correlation Chart
The statistical analysis conducted on geographies consisting of 167,967,636 people shows no correlation between the proportion of Immigrants from Austria and percentage of population currently divorced or separated in the United States with a correlation coefficient (R) of 0.032 and weighted average of 11.8%. Similarly, the statistical analysis conducted on geographies consisting of 45,819,627 people shows a slight negative correlation between the proportion of Alaskan Athabascans and percentage of population currently divorced or separated in the United States with a correlation coefficient (R) of -0.084 and weighted average of 13.1%, a difference of 10.8%.
Divorced or Separated Correlation Summary
| Measurement | Immigrants from Austria | Alaskan Athabascan |
| Minimum | 1.5% | 3.3% |
| Maximum | 23.9% | 40.9% |
| Range | 22.4% | 37.6% |
| Mean | 12.7% | 14.1% |
| Median | 12.0% | 13.0% |
| Interquartile 25% (IQ1) | 10.8% | 9.9% |
| Interquartile 75% (IQ3) | 13.6% | 18.4% |
| Interquartile Range (IQR) | 2.8% | 8.5% |
| Standard Deviation (Sample) | 3.8% | 7.0% |
| Standard Deviation (Population) | 3.8% | 6.9% |
Similar Demographics by Divorced or Separated
Demographics Similar to Immigrants from Austria by Divorced or Separated
In terms of divorced or separated, the demographic groups most similar to Immigrants from Austria are Immigrants from Cambodia (11.8%, a difference of 0.0%), Immigrants from St. Vincent and the Grenadines (11.8%, a difference of 0.010%), Immigrants from Afghanistan (11.8%, a difference of 0.030%), Immigrants from Ecuador (11.8%, a difference of 0.050%), and South African (11.8%, a difference of 0.060%).
| Demographics | Rating | Rank | Divorced or Separated |
| Immigrants | Immigrants | 93.7 /100 | #123 | Exceptional 11.8% |
| Ugandans | 93.1 /100 | #124 | Exceptional 11.8% |
| Ukrainians | 92.3 /100 | #125 | Exceptional 11.8% |
| South American Indians | 92.1 /100 | #126 | Exceptional 11.8% |
| South Africans | 88.9 /100 | #127 | Excellent 11.8% |
| Immigrants | Ecuador | 88.9 /100 | #128 | Excellent 11.8% |
| Immigrants | St. Vincent and the Grenadines | 88.4 /100 | #129 | Excellent 11.8% |
| Immigrants | Austria | 88.2 /100 | #130 | Excellent 11.8% |
| Immigrants | Cambodia | 88.2 /100 | #131 | Excellent 11.8% |
| Immigrants | Afghanistan | 87.9 /100 | #132 | Excellent 11.8% |
| New Zealanders | 87.5 /100 | #133 | Excellent 11.9% |
| Argentineans | 85.1 /100 | #134 | Excellent 11.9% |
| Danes | 84.8 /100 | #135 | Excellent 11.9% |
| Carpatho Rusyns | 84.8 /100 | #136 | Excellent 11.9% |
| Alsatians | 84.0 /100 | #137 | Excellent 11.9% |
Demographics Similar to Alaskan Athabascans by Divorced or Separated
In terms of divorced or separated, the demographic groups most similar to Alaskan Athabascans are Immigrants from Venezuela (13.1%, a difference of 0.10%), Cape Verdean (13.1%, a difference of 0.12%), Immigrants from Cabo Verde (13.1%, a difference of 0.21%), Hopi (13.2%, a difference of 0.25%), and Chippewa (13.2%, a difference of 0.30%).
| Demographics | Rating | Rank | Divorced or Separated |
| Apache | 0.0 /100 | #294 | Tragic 12.9% |
| Celtics | 0.0 /100 | #295 | Tragic 13.0% |
| Nicaraguans | 0.0 /100 | #296 | Tragic 13.0% |
| Natives/Alaskans | 0.0 /100 | #297 | Tragic 13.0% |
| Venezuelans | 0.0 /100 | #298 | Tragic 13.0% |
| Immigrants | Jamaica | 0.0 /100 | #299 | Tragic 13.0% |
| Immigrants | Cabo Verde | 0.0 /100 | #300 | Tragic 13.1% |
| Alaskan Athabascans | 0.0 /100 | #301 | Tragic 13.1% |
| Immigrants | Venezuela | 0.0 /100 | #302 | Tragic 13.1% |
| Cape Verdeans | 0.0 /100 | #303 | Tragic 13.1% |
| Hopi | 0.0 /100 | #304 | Tragic 13.2% |
| Chippewa | 0.0 /100 | #305 | Tragic 13.2% |
| Tlingit-Haida | 0.0 /100 | #306 | Tragic 13.2% |
| French American Indians | 0.0 /100 | #307 | Tragic 13.2% |
| Ottawa | 0.0 /100 | #308 | Tragic 13.2% |