Immigrants from Australia vs Seminole Single Mother Households
COMPARE
Immigrants from Australia
Seminole
Single Mother Households
Single Mother Households Comparison
Immigrants from Australia
Seminole
5.1%
SINGLE MOTHER HOUSEHOLDS
99.9/ 100
METRIC RATING
14th/ 347
METRIC RANK
7.4%
SINGLE MOTHER HOUSEHOLDS
0.2/ 100
METRIC RATING
256th/ 347
METRIC RANK
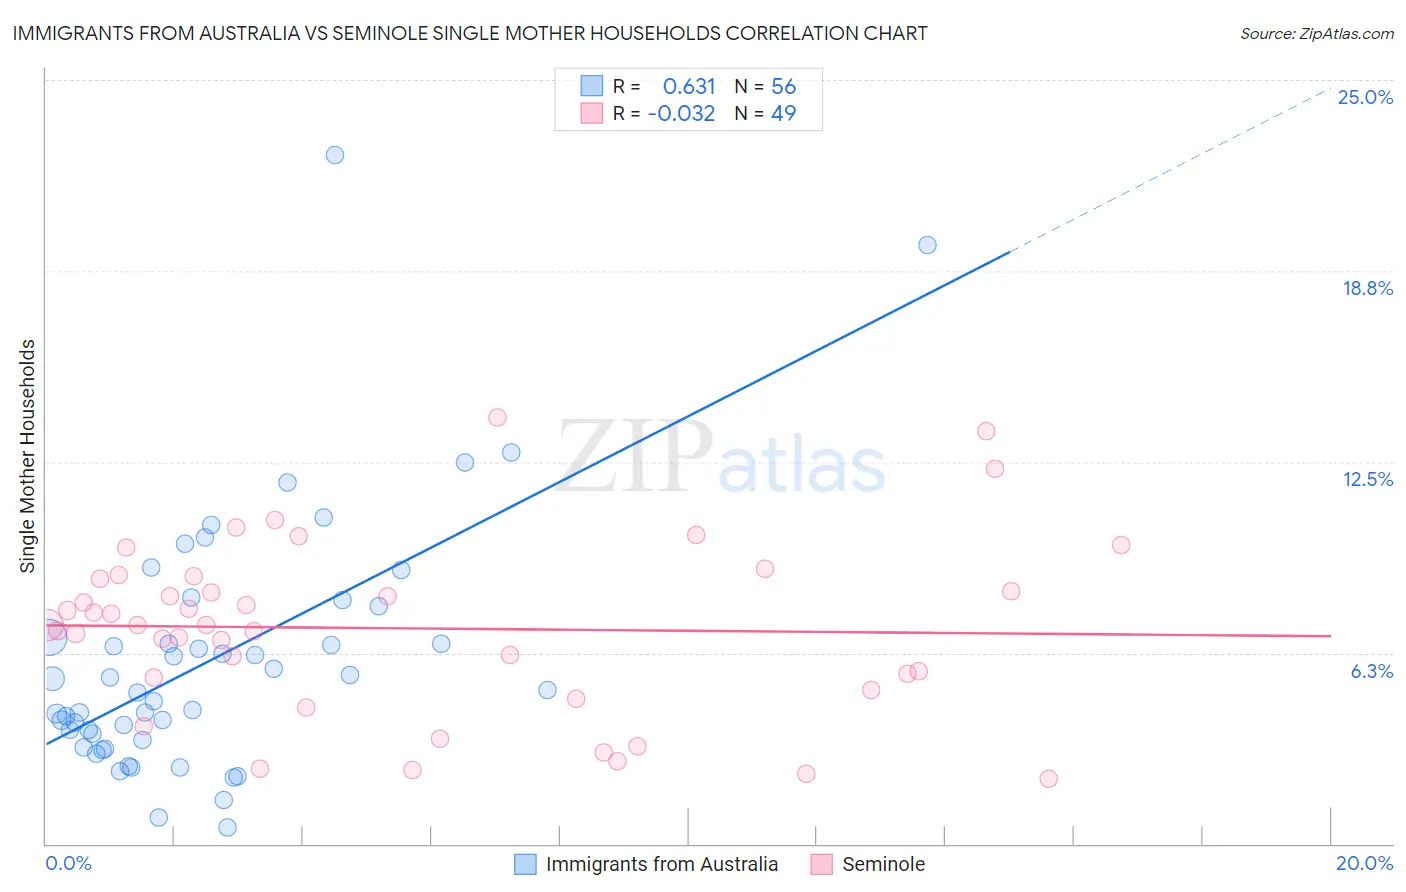
Immigrants from Australia vs Seminole Single Mother Households Correlation Chart
The statistical analysis conducted on geographies consisting of 226,768,478 people shows a significant positive correlation between the proportion of Immigrants from Australia and percentage of single mother households in the United States with a correlation coefficient (R) of 0.631 and weighted average of 5.1%. Similarly, the statistical analysis conducted on geographies consisting of 118,254,419 people shows no correlation between the proportion of Seminole and percentage of single mother households in the United States with a correlation coefficient (R) of -0.032 and weighted average of 7.4%, a difference of 45.2%.
Single Mother Households Correlation Summary
| Measurement | Immigrants from Australia | Seminole |
| Minimum | 0.54% | 2.1% |
| Maximum | 22.6% | 13.9% |
| Range | 22.0% | 11.8% |
| Mean | 6.0% | 7.0% |
| Median | 5.0% | 7.2% |
| Interquartile 25% (IQ1) | 3.5% | 5.2% |
| Interquartile 75% (IQ3) | 7.3% | 8.7% |
| Interquartile Range (IQR) | 3.8% | 3.5% |
| Standard Deviation (Sample) | 4.1% | 2.8% |
| Standard Deviation (Population) | 4.1% | 2.8% |
Similar Demographics by Single Mother Households
Demographics Similar to Immigrants from Australia by Single Mother Households
In terms of single mother households, the demographic groups most similar to Immigrants from Australia are Immigrants from Eastern Asia (5.1%, a difference of 0.090%), Indian (Asian) (5.1%, a difference of 0.28%), Immigrants from India (5.1%, a difference of 0.32%), Cypriot (5.1%, a difference of 0.45%), and Soviet Union (5.1%, a difference of 0.49%).
| Demographics | Rating | Rank | Single Mother Households |
| Iranians | 100.0 /100 | #7 | Exceptional 5.0% |
| Immigrants | Ireland | 99.9 /100 | #8 | Exceptional 5.0% |
| Okinawans | 99.9 /100 | #9 | Exceptional 5.0% |
| Immigrants | Israel | 99.9 /100 | #10 | Exceptional 5.0% |
| Immigrants | China | 99.9 /100 | #11 | Exceptional 5.1% |
| Cypriots | 99.9 /100 | #12 | Exceptional 5.1% |
| Immigrants | India | 99.9 /100 | #13 | Exceptional 5.1% |
| Immigrants | Australia | 99.9 /100 | #14 | Exceptional 5.1% |
| Immigrants | Eastern Asia | 99.9 /100 | #15 | Exceptional 5.1% |
| Indians (Asian) | 99.9 /100 | #16 | Exceptional 5.1% |
| Soviet Union | 99.9 /100 | #17 | Exceptional 5.1% |
| Immigrants | Armenia | 99.9 /100 | #18 | Exceptional 5.2% |
| Chinese | 99.9 /100 | #19 | Exceptional 5.2% |
| Maltese | 99.9 /100 | #20 | Exceptional 5.2% |
| Eastern Europeans | 99.8 /100 | #21 | Exceptional 5.2% |
Demographics Similar to Seminole by Single Mother Households
In terms of single mother households, the demographic groups most similar to Seminole are Alaska Native (7.4%, a difference of 0.040%), Pueblo (7.4%, a difference of 0.060%), Immigrants from Yemen (7.4%, a difference of 0.080%), Immigrants from Zaire (7.4%, a difference of 0.13%), and Japanese (7.4%, a difference of 0.15%).
| Demographics | Rating | Rank | Single Mother Households |
| Bermudans | 0.4 /100 | #249 | Tragic 7.3% |
| Immigrants | Africa | 0.4 /100 | #250 | Tragic 7.3% |
| Malaysians | 0.3 /100 | #251 | Tragic 7.3% |
| Alaskan Athabascans | 0.3 /100 | #252 | Tragic 7.3% |
| Cajuns | 0.3 /100 | #253 | Tragic 7.3% |
| Immigrants | Ecuador | 0.3 /100 | #254 | Tragic 7.3% |
| Mexican American Indians | 0.2 /100 | #255 | Tragic 7.4% |
| Seminole | 0.2 /100 | #256 | Tragic 7.4% |
| Alaska Natives | 0.2 /100 | #257 | Tragic 7.4% |
| Pueblo | 0.2 /100 | #258 | Tragic 7.4% |
| Immigrants | Yemen | 0.2 /100 | #259 | Tragic 7.4% |
| Immigrants | Zaire | 0.2 /100 | #260 | Tragic 7.4% |
| Japanese | 0.2 /100 | #261 | Tragic 7.4% |
| Immigrants | Somalia | 0.2 /100 | #262 | Tragic 7.4% |
| Immigrants | Nicaragua | 0.2 /100 | #263 | Tragic 7.4% |