Immigrants from Asia vs Slovak Divorced or Separated
COMPARE
Immigrants from Asia
Slovak
Divorced or Separated
Divorced or Separated Comparison
Immigrants from Asia
Slovaks
10.7%
DIVORCED OR SEPARATED
100.0/ 100
METRIC RATING
21st/ 347
METRIC RANK
12.2%
DIVORCED OR SEPARATED
21.0/ 100
METRIC RATING
206th/ 347
METRIC RANK
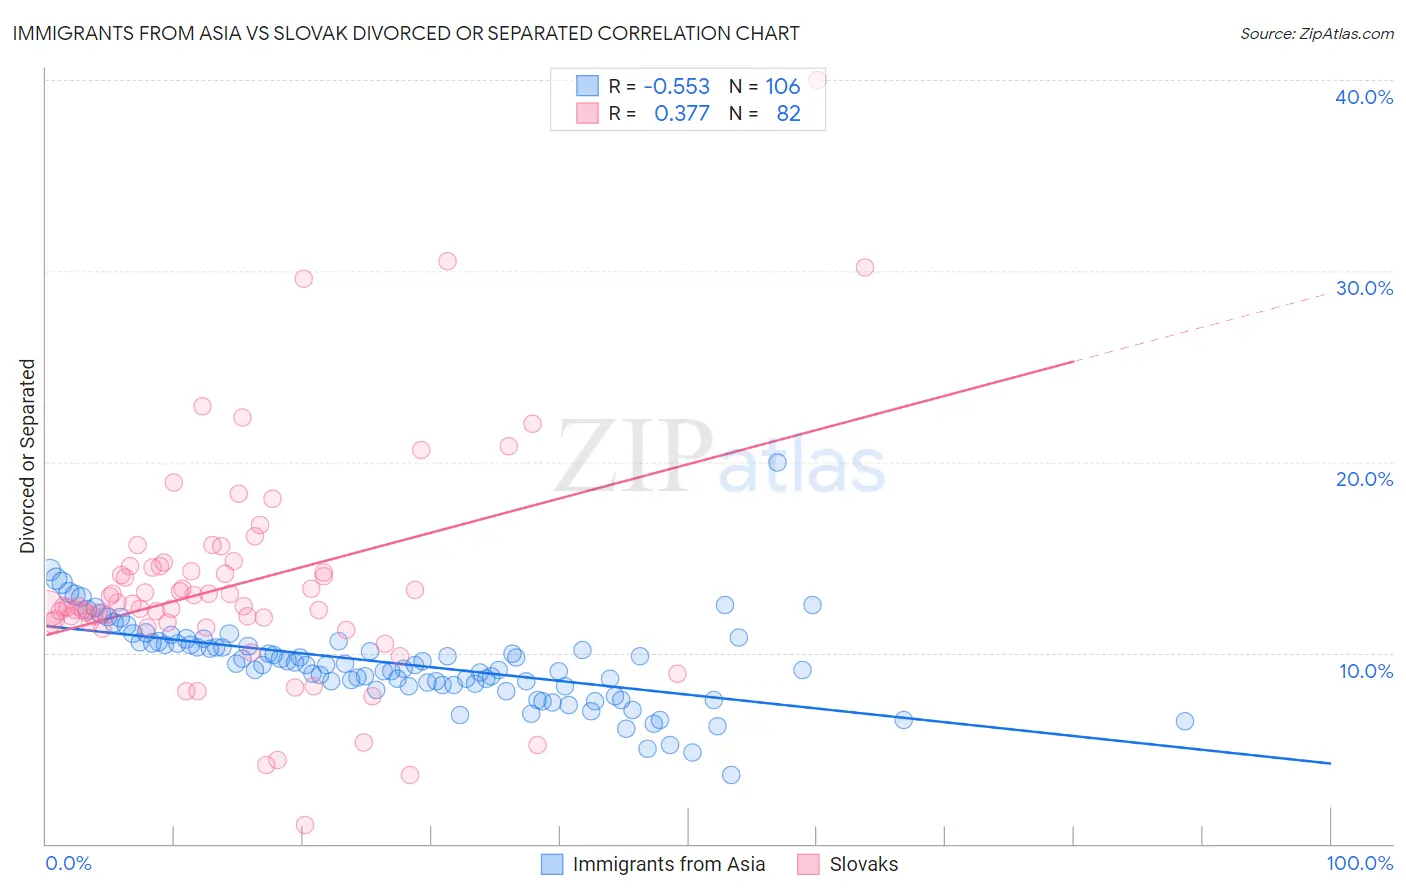
Immigrants from Asia vs Slovak Divorced or Separated Correlation Chart
The statistical analysis conducted on geographies consisting of 548,726,579 people shows a substantial negative correlation between the proportion of Immigrants from Asia and percentage of population currently divorced or separated in the United States with a correlation coefficient (R) of -0.553 and weighted average of 10.7%. Similarly, the statistical analysis conducted on geographies consisting of 397,744,388 people shows a mild positive correlation between the proportion of Slovaks and percentage of population currently divorced or separated in the United States with a correlation coefficient (R) of 0.377 and weighted average of 12.2%, a difference of 13.6%.
Divorced or Separated Correlation Summary
| Measurement | Immigrants from Asia | Slovak |
| Minimum | 3.6% | 1.0% |
| Maximum | 20.0% | 40.0% |
| Range | 16.4% | 39.0% |
| Mean | 9.4% | 13.6% |
| Median | 9.4% | 12.4% |
| Interquartile 25% (IQ1) | 8.3% | 11.6% |
| Interquartile 75% (IQ3) | 10.5% | 14.6% |
| Interquartile Range (IQR) | 2.2% | 3.0% |
| Standard Deviation (Sample) | 2.3% | 5.9% |
| Standard Deviation (Population) | 2.2% | 5.9% |
Similar Demographics by Divorced or Separated
Demographics Similar to Immigrants from Asia by Divorced or Separated
In terms of divorced or separated, the demographic groups most similar to Immigrants from Asia are Burmese (10.7%, a difference of 0.18%), Vietnamese (10.8%, a difference of 0.26%), Immigrants from Pakistan (10.8%, a difference of 0.43%), Immigrants from Sri Lanka (10.8%, a difference of 0.63%), and Iranian (10.8%, a difference of 0.68%).
| Demographics | Rating | Rank | Divorced or Separated |
| Assyrians/Chaldeans/Syriacs | 100.0 /100 | #14 | Exceptional 10.6% |
| Immigrants | Armenia | 100.0 /100 | #15 | Exceptional 10.6% |
| Immigrants | Korea | 100.0 /100 | #16 | Exceptional 10.6% |
| Immigrants | Israel | 100.0 /100 | #17 | Exceptional 10.6% |
| Immigrants | Iran | 100.0 /100 | #18 | Exceptional 10.6% |
| Asians | 100.0 /100 | #19 | Exceptional 10.6% |
| Burmese | 100.0 /100 | #20 | Exceptional 10.7% |
| Immigrants | Asia | 100.0 /100 | #21 | Exceptional 10.7% |
| Vietnamese | 100.0 /100 | #22 | Exceptional 10.8% |
| Immigrants | Pakistan | 100.0 /100 | #23 | Exceptional 10.8% |
| Immigrants | Sri Lanka | 100.0 /100 | #24 | Exceptional 10.8% |
| Iranians | 100.0 /100 | #25 | Exceptional 10.8% |
| Immigrants | Indonesia | 100.0 /100 | #26 | Exceptional 10.9% |
| Immigrants | Bangladesh | 100.0 /100 | #27 | Exceptional 11.0% |
| Immigrants | Malaysia | 100.0 /100 | #28 | Exceptional 11.0% |
Demographics Similar to Slovaks by Divorced or Separated
In terms of divorced or separated, the demographic groups most similar to Slovaks are Mexican (12.2%, a difference of 0.0%), Immigrants from Costa Rica (12.2%, a difference of 0.010%), Kenyan (12.2%, a difference of 0.040%), Immigrants from Guatemala (12.2%, a difference of 0.11%), and Portuguese (12.2%, a difference of 0.12%).
| Demographics | Rating | Rank | Divorced or Separated |
| Central Americans | 29.4 /100 | #199 | Fair 12.1% |
| South Americans | 28.6 /100 | #200 | Fair 12.2% |
| Guatemalans | 26.9 /100 | #201 | Fair 12.2% |
| Portuguese | 23.5 /100 | #202 | Fair 12.2% |
| Immigrants | Guatemala | 23.2 /100 | #203 | Fair 12.2% |
| Kenyans | 21.8 /100 | #204 | Fair 12.2% |
| Immigrants | Costa Rica | 21.3 /100 | #205 | Fair 12.2% |
| Slovaks | 21.0 /100 | #206 | Fair 12.2% |
| Mexicans | 21.0 /100 | #207 | Fair 12.2% |
| Immigrants | Ghana | 18.8 /100 | #208 | Poor 12.2% |
| Immigrants | Trinidad and Tobago | 17.8 /100 | #209 | Poor 12.2% |
| Slavs | 17.0 /100 | #210 | Poor 12.2% |
| Trinidadians and Tobagonians | 16.6 /100 | #211 | Poor 12.2% |
| Immigrants | Kenya | 16.5 /100 | #212 | Poor 12.2% |
| Immigrants | Eastern Africa | 16.2 /100 | #213 | Poor 12.2% |