Immigrants from Asia vs Immigrants from Argentina Currently Married
COMPARE
Immigrants from Asia
Immigrants from Argentina
Currently Married
Currently Married Comparison
Immigrants from Asia
Immigrants from Argentina
48.3%
CURRENTLY MARRIED
97.9/ 100
METRIC RATING
70th/ 347
METRIC RANK
47.0%
CURRENTLY MARRIED
72.0/ 100
METRIC RATING
147th/ 347
METRIC RANK
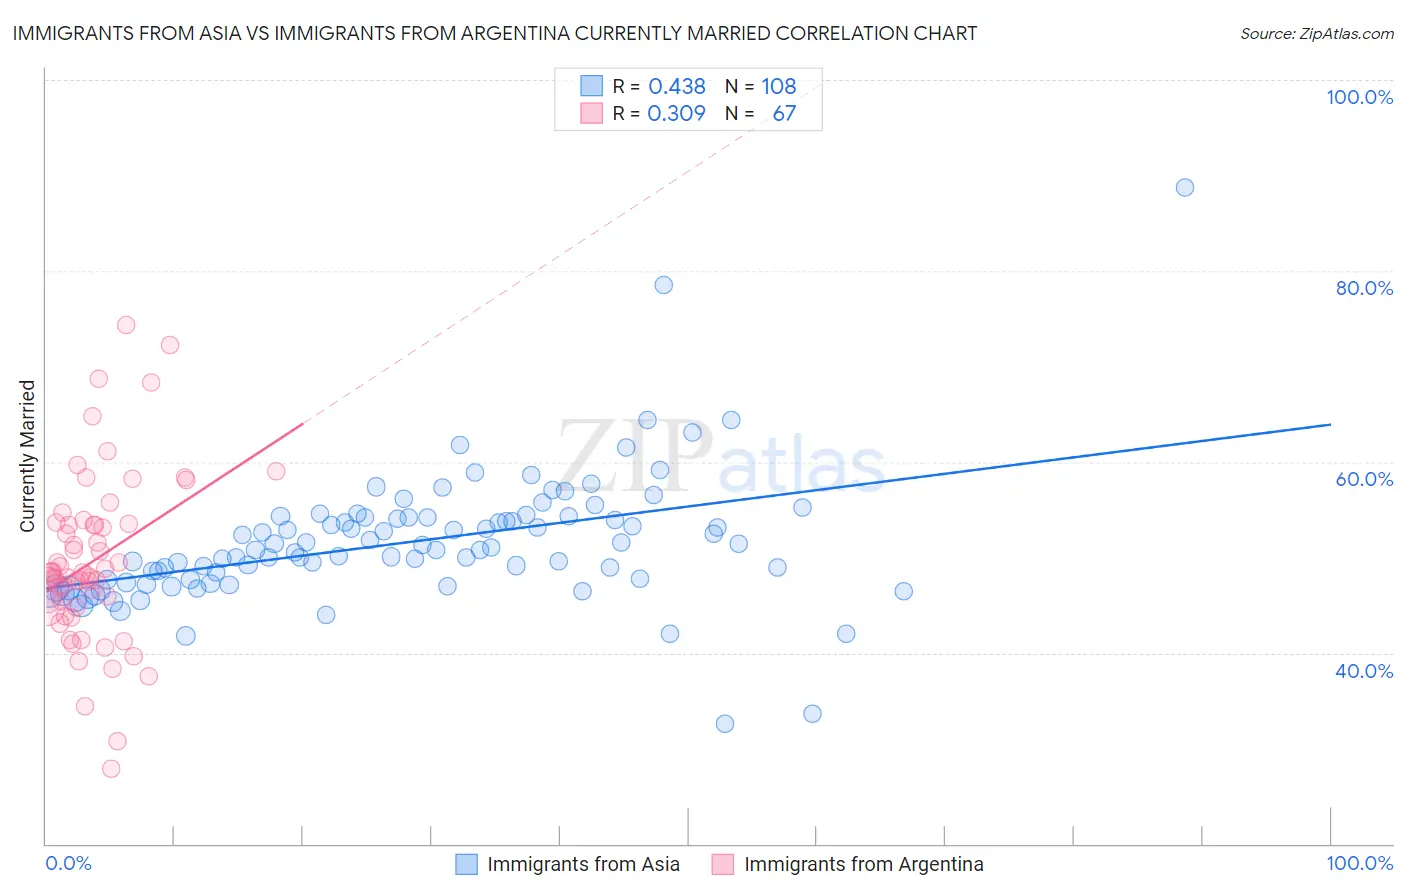
Immigrants from Asia vs Immigrants from Argentina Currently Married Correlation Chart
The statistical analysis conducted on geographies consisting of 549,041,877 people shows a moderate positive correlation between the proportion of Immigrants from Asia and percentage of population currently married in the United States with a correlation coefficient (R) of 0.438 and weighted average of 48.3%. Similarly, the statistical analysis conducted on geographies consisting of 264,414,041 people shows a mild positive correlation between the proportion of Immigrants from Argentina and percentage of population currently married in the United States with a correlation coefficient (R) of 0.309 and weighted average of 47.0%, a difference of 2.6%.
Currently Married Correlation Summary
| Measurement | Immigrants from Asia | Immigrants from Argentina |
| Minimum | 32.6% | 27.9% |
| Maximum | 88.7% | 74.4% |
| Range | 56.1% | 46.5% |
| Mean | 51.6% | 49.6% |
| Median | 50.8% | 48.4% |
| Interquartile 25% (IQ1) | 47.5% | 44.8% |
| Interquartile 75% (IQ3) | 54.2% | 53.5% |
| Interquartile Range (IQR) | 6.7% | 8.7% |
| Standard Deviation (Sample) | 6.9% | 8.8% |
| Standard Deviation (Population) | 6.9% | 8.7% |
Similar Demographics by Currently Married
Demographics Similar to Immigrants from Asia by Currently Married
In terms of currently married, the demographic groups most similar to Immigrants from Asia are Macedonian (48.3%, a difference of 0.010%), Canadian (48.3%, a difference of 0.090%), Immigrants from England (48.3%, a difference of 0.10%), Slovak (48.3%, a difference of 0.11%), and Tongan (48.3%, a difference of 0.12%).
| Demographics | Rating | Rank | Currently Married |
| Slavs | 98.3 /100 | #63 | Exceptional 48.4% |
| Immigrants | Czechoslovakia | 98.3 /100 | #64 | Exceptional 48.4% |
| Ukrainians | 98.3 /100 | #65 | Exceptional 48.4% |
| Tongans | 98.2 /100 | #66 | Exceptional 48.3% |
| Slovaks | 98.2 /100 | #67 | Exceptional 48.3% |
| Immigrants | England | 98.2 /100 | #68 | Exceptional 48.3% |
| Canadians | 98.1 /100 | #69 | Exceptional 48.3% |
| Immigrants | Asia | 97.9 /100 | #70 | Exceptional 48.3% |
| Macedonians | 97.9 /100 | #71 | Exceptional 48.3% |
| Immigrants | Lebanon | 97.6 /100 | #72 | Exceptional 48.2% |
| Immigrants | Eastern Asia | 97.5 /100 | #73 | Exceptional 48.2% |
| Estonians | 97.4 /100 | #74 | Exceptional 48.2% |
| Immigrants | Belarus | 97.2 /100 | #75 | Exceptional 48.1% |
| Basques | 97.2 /100 | #76 | Exceptional 48.1% |
| Slovenes | 97.1 /100 | #77 | Exceptional 48.1% |
Demographics Similar to Immigrants from Argentina by Currently Married
In terms of currently married, the demographic groups most similar to Immigrants from Argentina are Carpatho Rusyn (47.0%, a difference of 0.030%), Immigrants from South Eastern Asia (47.1%, a difference of 0.040%), Hmong (47.1%, a difference of 0.060%), Cambodian (47.0%, a difference of 0.070%), and Zimbabwean (47.0%, a difference of 0.090%).
| Demographics | Rating | Rank | Currently Married |
| Cajuns | 75.3 /100 | #140 | Good 47.1% |
| Venezuelans | 74.4 /100 | #141 | Good 47.1% |
| Argentineans | 74.4 /100 | #142 | Good 47.1% |
| Guamanians/Chamorros | 74.2 /100 | #143 | Good 47.1% |
| Hmong | 73.4 /100 | #144 | Good 47.1% |
| Immigrants | South Eastern Asia | 72.9 /100 | #145 | Good 47.1% |
| Carpatho Rusyns | 72.6 /100 | #146 | Good 47.0% |
| Immigrants | Argentina | 72.0 /100 | #147 | Good 47.0% |
| Cambodians | 70.4 /100 | #148 | Good 47.0% |
| Zimbabweans | 70.1 /100 | #149 | Good 47.0% |
| Immigrants | Turkey | 70.0 /100 | #150 | Good 47.0% |
| Chileans | 69.8 /100 | #151 | Good 47.0% |
| Immigrants | Serbia | 68.8 /100 | #152 | Good 47.0% |
| Immigrants | Venezuela | 68.6 /100 | #153 | Good 47.0% |
| Albanians | 68.6 /100 | #154 | Good 47.0% |