Immigrants from Argentina vs Immigrants from South America Single Father Households
COMPARE
Immigrants from Argentina
Immigrants from South America
Single Father Households
Single Father Households Comparison
Immigrants from Argentina
Immigrants from South America
2.2%
SINGLE FATHER HOUSEHOLDS
98.1/ 100
METRIC RATING
116th/ 347
METRIC RANK
2.3%
SINGLE FATHER HOUSEHOLDS
79.9/ 100
METRIC RATING
156th/ 347
METRIC RANK
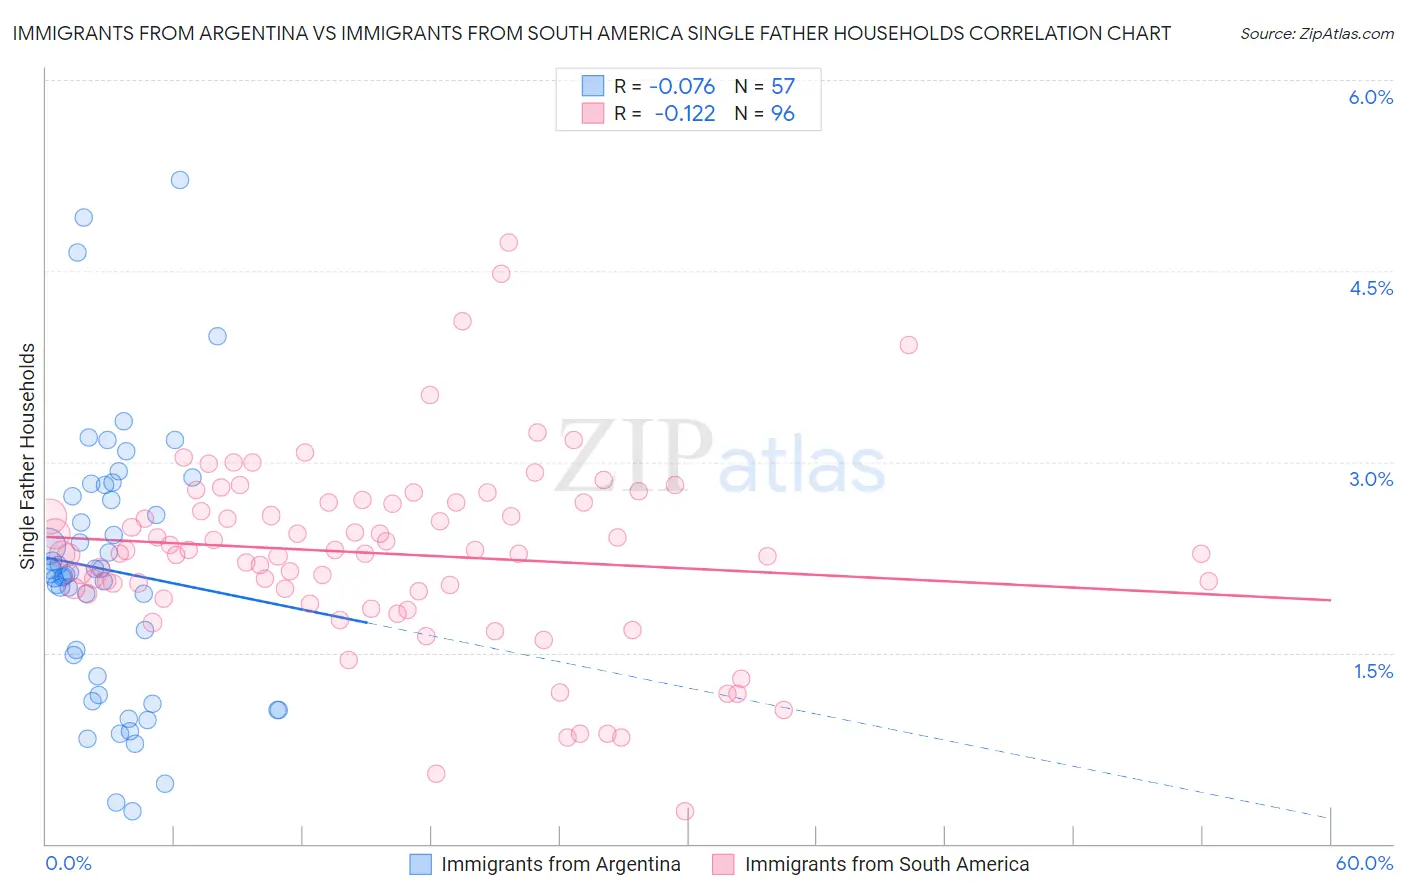
Immigrants from Argentina vs Immigrants from South America Single Father Households Correlation Chart
The statistical analysis conducted on geographies consisting of 263,186,276 people shows a slight negative correlation between the proportion of Immigrants from Argentina and percentage of single father households in the United States with a correlation coefficient (R) of -0.076 and weighted average of 2.2%. Similarly, the statistical analysis conducted on geographies consisting of 479,744,076 people shows a poor negative correlation between the proportion of Immigrants from South America and percentage of single father households in the United States with a correlation coefficient (R) of -0.122 and weighted average of 2.3%, a difference of 5.1%.
Single Father Households Correlation Summary
| Measurement | Immigrants from Argentina | Immigrants from South America |
| Minimum | 0.26% | 0.26% |
| Maximum | 5.2% | 4.7% |
| Range | 5.0% | 4.5% |
| Mean | 2.1% | 2.3% |
| Median | 2.1% | 2.3% |
| Interquartile 25% (IQ1) | 1.2% | 2.0% |
| Interquartile 75% (IQ3) | 2.8% | 2.7% |
| Interquartile Range (IQR) | 1.5% | 0.71% |
| Standard Deviation (Sample) | 1.1% | 0.75% |
| Standard Deviation (Population) | 1.0% | 0.74% |
Similar Demographics by Single Father Households
Demographics Similar to Immigrants from Argentina by Single Father Households
In terms of single father households, the demographic groups most similar to Immigrants from Argentina are Immigrants from Barbados (2.2%, a difference of 0.030%), Immigrants from North America (2.2%, a difference of 0.060%), Iraqi (2.2%, a difference of 0.10%), Immigrants from Trinidad and Tobago (2.2%, a difference of 0.11%), and Immigrants from Canada (2.2%, a difference of 0.15%).
| Demographics | Rating | Rank | Single Father Households |
| Barbadians | 98.4 /100 | #109 | Exceptional 2.2% |
| Italians | 98.3 /100 | #110 | Exceptional 2.2% |
| Immigrants | Canada | 98.3 /100 | #111 | Exceptional 2.2% |
| Immigrants | Trinidad and Tobago | 98.2 /100 | #112 | Exceptional 2.2% |
| Iraqis | 98.2 /100 | #113 | Exceptional 2.2% |
| Immigrants | North America | 98.2 /100 | #114 | Exceptional 2.2% |
| Immigrants | Barbados | 98.2 /100 | #115 | Exceptional 2.2% |
| Immigrants | Argentina | 98.1 /100 | #116 | Exceptional 2.2% |
| Hungarians | 97.9 /100 | #117 | Exceptional 2.2% |
| Immigrants | Morocco | 97.8 /100 | #118 | Exceptional 2.2% |
| Trinidadians and Tobagonians | 97.8 /100 | #119 | Exceptional 2.2% |
| Australians | 97.7 /100 | #120 | Exceptional 2.2% |
| Immigrants | Brazil | 97.7 /100 | #121 | Exceptional 2.2% |
| Immigrants | Iraq | 97.6 /100 | #122 | Exceptional 2.2% |
| Immigrants | Yemen | 97.5 /100 | #123 | Exceptional 2.2% |
Demographics Similar to Immigrants from South America by Single Father Households
In terms of single father households, the demographic groups most similar to Immigrants from South America are Canadian (2.3%, a difference of 0.020%), Immigrants from Senegal (2.3%, a difference of 0.050%), European (2.3%, a difference of 0.12%), Bolivian (2.3%, a difference of 0.14%), and Immigrants from West Indies (2.3%, a difference of 0.22%).
| Demographics | Rating | Rank | Single Father Households |
| Senegalese | 88.4 /100 | #149 | Excellent 2.3% |
| Venezuelans | 86.2 /100 | #150 | Excellent 2.3% |
| Immigrants | Syria | 84.8 /100 | #151 | Excellent 2.3% |
| Immigrants | Venezuela | 83.2 /100 | #152 | Excellent 2.3% |
| Immigrants | Germany | 82.8 /100 | #153 | Excellent 2.3% |
| Bolivians | 81.0 /100 | #154 | Excellent 2.3% |
| Europeans | 80.9 /100 | #155 | Excellent 2.3% |
| Immigrants | South America | 79.9 /100 | #156 | Good 2.3% |
| Canadians | 79.7 /100 | #157 | Good 2.3% |
| Immigrants | Senegal | 79.4 /100 | #158 | Good 2.3% |
| Immigrants | West Indies | 77.9 /100 | #159 | Good 2.3% |
| Immigrants | Bolivia | 76.3 /100 | #160 | Good 2.3% |
| Swiss | 73.2 /100 | #161 | Good 2.3% |
| Scottish | 72.8 /100 | #162 | Good 2.3% |
| Irish | 72.1 /100 | #163 | Good 2.3% |