Immigrants from Africa vs Panamanian Currently Married
COMPARE
Immigrants from Africa
Panamanian
Currently Married
Currently Married Comparison
Immigrants from Africa
Panamanians
43.9%
CURRENTLY MARRIED
0.2/ 100
METRIC RATING
257th/ 347
METRIC RANK
45.3%
CURRENTLY MARRIED
4.0/ 100
METRIC RATING
218th/ 347
METRIC RANK
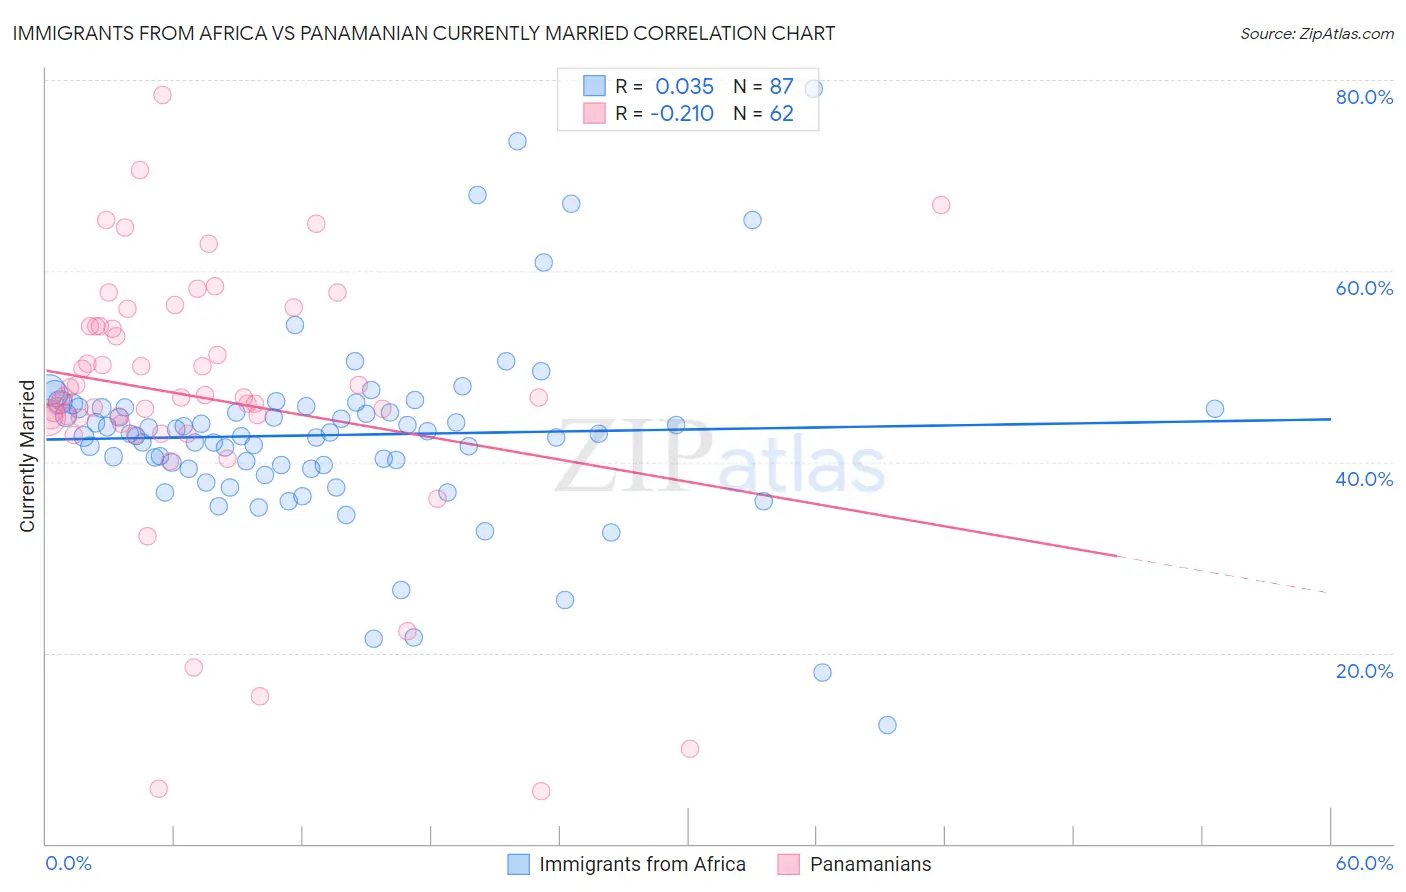
Immigrants from Africa vs Panamanian Currently Married Correlation Chart
The statistical analysis conducted on geographies consisting of 469,352,442 people shows no correlation between the proportion of Immigrants from Africa and percentage of population currently married in the United States with a correlation coefficient (R) of 0.035 and weighted average of 43.9%. Similarly, the statistical analysis conducted on geographies consisting of 281,208,339 people shows a weak negative correlation between the proportion of Panamanians and percentage of population currently married in the United States with a correlation coefficient (R) of -0.210 and weighted average of 45.3%, a difference of 3.2%.
Currently Married Correlation Summary
| Measurement | Immigrants from Africa | Panamanian |
| Minimum | 12.5% | 5.5% |
| Maximum | 79.1% | 78.4% |
| Range | 66.6% | 72.9% |
| Mean | 42.8% | 46.8% |
| Median | 43.0% | 46.8% |
| Interquartile 25% (IQ1) | 39.3% | 44.6% |
| Interquartile 75% (IQ3) | 45.6% | 54.2% |
| Interquartile Range (IQR) | 6.4% | 9.5% |
| Standard Deviation (Sample) | 10.0% | 14.0% |
| Standard Deviation (Population) | 10.0% | 13.9% |
Similar Demographics by Currently Married
Demographics Similar to Immigrants from Africa by Currently Married
In terms of currently married, the demographic groups most similar to Immigrants from Africa are Ute (43.9%, a difference of 0.010%), Shoshone (44.0%, a difference of 0.20%), Immigrants from Sierra Leone (43.8%, a difference of 0.22%), Yakama (44.0%, a difference of 0.25%), and Immigrants from Latin America (43.8%, a difference of 0.28%).
| Demographics | Rating | Rank | Currently Married |
| Immigrants | Eastern Africa | 0.3 /100 | #250 | Tragic 44.2% |
| Blackfeet | 0.3 /100 | #251 | Tragic 44.2% |
| Hispanics or Latinos | 0.3 /100 | #252 | Tragic 44.1% |
| Immigrants | Central America | 0.3 /100 | #253 | Tragic 44.1% |
| Vietnamese | 0.2 /100 | #254 | Tragic 44.0% |
| Yakama | 0.2 /100 | #255 | Tragic 44.0% |
| Shoshone | 0.2 /100 | #256 | Tragic 44.0% |
| Immigrants | Africa | 0.2 /100 | #257 | Tragic 43.9% |
| Ute | 0.2 /100 | #258 | Tragic 43.9% |
| Immigrants | Sierra Leone | 0.1 /100 | #259 | Tragic 43.8% |
| Immigrants | Latin America | 0.1 /100 | #260 | Tragic 43.8% |
| Immigrants | Nicaragua | 0.1 /100 | #261 | Tragic 43.7% |
| Bangladeshis | 0.1 /100 | #262 | Tragic 43.7% |
| Immigrants | Cuba | 0.1 /100 | #263 | Tragic 43.7% |
| Sudanese | 0.1 /100 | #264 | Tragic 43.7% |
Demographics Similar to Panamanians by Currently Married
In terms of currently married, the demographic groups most similar to Panamanians are Immigrants from Portugal (45.2%, a difference of 0.12%), Immigrants from Thailand (45.4%, a difference of 0.24%), Kenyan (45.2%, a difference of 0.24%), Mexican (45.2%, a difference of 0.26%), and Immigrants from Morocco (45.4%, a difference of 0.33%).
| Demographics | Rating | Rank | Currently Married |
| Houma | 7.2 /100 | #211 | Tragic 45.5% |
| Marshallese | 7.2 /100 | #212 | Tragic 45.5% |
| Alaska Natives | 7.0 /100 | #213 | Tragic 45.5% |
| Dutch West Indians | 6.7 /100 | #214 | Tragic 45.5% |
| German Russians | 6.7 /100 | #215 | Tragic 45.5% |
| Immigrants | Morocco | 5.5 /100 | #216 | Tragic 45.4% |
| Immigrants | Thailand | 5.1 /100 | #217 | Tragic 45.4% |
| Panamanians | 4.0 /100 | #218 | Tragic 45.3% |
| Immigrants | Portugal | 3.5 /100 | #219 | Tragic 45.2% |
| Kenyans | 3.1 /100 | #220 | Tragic 45.2% |
| Mexicans | 3.0 /100 | #221 | Tragic 45.2% |
| Immigrants | Azores | 2.5 /100 | #222 | Tragic 45.1% |
| Immigrants | Laos | 2.3 /100 | #223 | Tragic 45.0% |
| Immigrants | Uganda | 2.2 /100 | #224 | Tragic 45.0% |
| French American Indians | 2.2 /100 | #225 | Tragic 45.0% |