Icelander vs Immigrants from Western Asia Divorced or Separated
COMPARE
Icelander
Immigrants from Western Asia
Divorced or Separated
Divorced or Separated Comparison
Icelanders
Immigrants from Western Asia
12.0%
DIVORCED OR SEPARATED
66.0/ 100
METRIC RATING
158th/ 347
METRIC RANK
11.2%
DIVORCED OR SEPARATED
100.0/ 100
METRIC RATING
44th/ 347
METRIC RANK
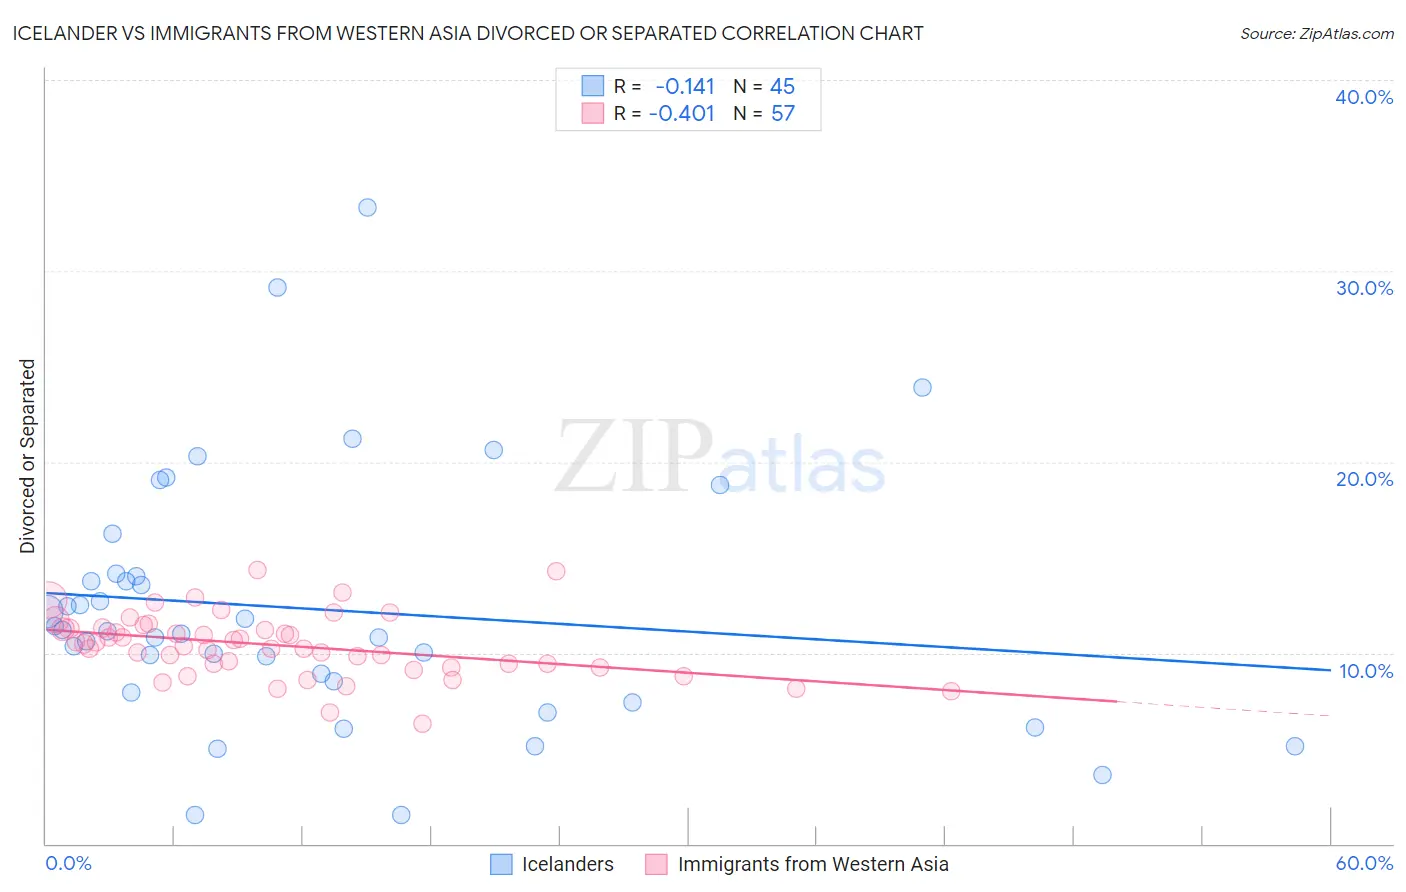
Icelander vs Immigrants from Western Asia Divorced or Separated Correlation Chart
The statistical analysis conducted on geographies consisting of 159,640,035 people shows a poor negative correlation between the proportion of Icelanders and percentage of population currently divorced or separated in the United States with a correlation coefficient (R) of -0.141 and weighted average of 12.0%. Similarly, the statistical analysis conducted on geographies consisting of 404,250,440 people shows a moderate negative correlation between the proportion of Immigrants from Western Asia and percentage of population currently divorced or separated in the United States with a correlation coefficient (R) of -0.401 and weighted average of 11.2%, a difference of 7.1%.
Divorced or Separated Correlation Summary
| Measurement | Icelander | Immigrants from Western Asia |
| Minimum | 1.5% | 6.3% |
| Maximum | 33.3% | 14.4% |
| Range | 31.8% | 8.1% |
| Mean | 12.3% | 10.4% |
| Median | 11.1% | 10.5% |
| Interquartile 25% (IQ1) | 8.2% | 9.3% |
| Interquartile 75% (IQ3) | 14.1% | 11.3% |
| Interquartile Range (IQR) | 5.9% | 2.0% |
| Standard Deviation (Sample) | 6.6% | 1.6% |
| Standard Deviation (Population) | 6.5% | 1.6% |
Similar Demographics by Divorced or Separated
Demographics Similar to Icelanders by Divorced or Separated
In terms of divorced or separated, the demographic groups most similar to Icelanders are Immigrants from Barbados (12.0%, a difference of 0.0%), Immigrants from Scotland (12.0%, a difference of 0.010%), Marshallese (12.0%, a difference of 0.060%), Samoan (12.0%, a difference of 0.070%), and Navajo (12.0%, a difference of 0.080%).
| Demographics | Rating | Rank | Divorced or Separated |
| Czechs | 76.4 /100 | #151 | Good 11.9% |
| Immigrants | Hungary | 73.7 /100 | #152 | Good 11.9% |
| Austrians | 72.2 /100 | #153 | Good 12.0% |
| Chileans | 71.3 /100 | #154 | Good 12.0% |
| Japanese | 70.9 /100 | #155 | Good 12.0% |
| Hungarians | 70.3 /100 | #156 | Good 12.0% |
| Immigrants | Brazil | 68.8 /100 | #157 | Good 12.0% |
| Icelanders | 66.0 /100 | #158 | Good 12.0% |
| Immigrants | Barbados | 66.0 /100 | #159 | Good 12.0% |
| Immigrants | Scotland | 65.8 /100 | #160 | Good 12.0% |
| Marshallese | 64.6 /100 | #161 | Good 12.0% |
| Samoans | 64.3 /100 | #162 | Good 12.0% |
| Navajo | 63.9 /100 | #163 | Good 12.0% |
| Swiss | 63.6 /100 | #164 | Good 12.0% |
| German Russians | 61.8 /100 | #165 | Good 12.0% |
Demographics Similar to Immigrants from Western Asia by Divorced or Separated
In terms of divorced or separated, the demographic groups most similar to Immigrants from Western Asia are Immigrants from Belarus (11.2%, a difference of 0.010%), Chinese (11.2%, a difference of 0.020%), Turkish (11.2%, a difference of 0.050%), Bhutanese (11.2%, a difference of 0.090%), and Laotian (11.2%, a difference of 0.16%).
| Demographics | Rating | Rank | Divorced or Separated |
| Immigrants | Lebanon | 100.0 /100 | #37 | Exceptional 11.1% |
| Immigrants | Greece | 100.0 /100 | #38 | Exceptional 11.1% |
| Immigrants | Egypt | 100.0 /100 | #39 | Exceptional 11.1% |
| Soviet Union | 100.0 /100 | #40 | Exceptional 11.1% |
| Bhutanese | 100.0 /100 | #41 | Exceptional 11.2% |
| Chinese | 100.0 /100 | #42 | Exceptional 11.2% |
| Immigrants | Belarus | 100.0 /100 | #43 | Exceptional 11.2% |
| Immigrants | Western Asia | 100.0 /100 | #44 | Exceptional 11.2% |
| Turks | 100.0 /100 | #45 | Exceptional 11.2% |
| Laotians | 100.0 /100 | #46 | Exceptional 11.2% |
| Immigrants | Poland | 100.0 /100 | #47 | Exceptional 11.2% |
| Immigrants | Turkey | 100.0 /100 | #48 | Exceptional 11.2% |
| Immigrants | Saudi Arabia | 100.0 /100 | #49 | Exceptional 11.2% |
| Bolivians | 100.0 /100 | #50 | Exceptional 11.2% |
| Immigrants | Bolivia | 100.0 /100 | #51 | Exceptional 11.3% |