Hungarian vs Japanese Single Mother Households

COMPARE

Hungarian
Race
Ancestry
AfghanAfricanAlaska NativeAlaskan AthabascanAlbanianAleutAlsatianAmericanApacheArabArapahoArgentineanArmenianAssyrian/Chaldean/SyriacAustralianAustrianBahamianBangladeshiBarbadianBasqueBelgianBelizeanBermudanBhutaneseBlackfeetBolivianBrazilianBritishBritish West IndianBulgarianBurmeseCajunCambodianCanadianCape VerdeanCarpatho RusynCelticCentral AmericanCentral American IndianCherokeeCheyenneChickasawChileanChineseChippewaChoctawColombianColvilleComancheCosta RicanCreeCreekCroatianCrowCubanCypriotCzechCzechoslovakianDanishDelawareDominicanDutchDutch West IndianEastern EuropeanEcuadorianEgyptianEnglishEstonianEthiopianEuropeanFijianFilipinoFinnishFrenchFrench American IndianFrench CanadianGermanGerman RussianGhanaianGreekGuamanian/ChamorroGuatemalanGuyaneseHaitianHmongHonduranHopiHoumaHungarianIcelanderIndian (Asian)IndonesianInupiatIranianIraqiIrishIroquoisIsraeliItalianJamaicanJordanianKenyanKiowaKoreanLaotianLatvianLebaneseLiberianLithuanianLumbeeLuxembourgerMacedonianMalaysianMalteseMarshalleseMenomineeMexicanMexican American IndianMongolianMoroccanNative HawaiianNavajoNepaleseNew ZealanderNicaraguanNigerianNorthern EuropeanNorwegianOkinawanOsageOttawaPaiutePakistaniPalestinianPanamanianParaguayanPennsylvania GermanPeruvianPimaPolishPortuguesePotawatomiPuebloPuerto RicanPuget Sound SalishRomanianRussianSalvadoranSamoanScandinavianScotch-IrishScottishSeminoleSenegaleseSerbianShoshoneSierra LeoneanSiouxSlavicSlovakSloveneSomaliSouth AfricanSouth AmericanSouth American IndianSoviet UnionSpaniardSpanishSpanish AmericanSpanish American IndianSri LankanSubsaharan AfricanSudaneseSwedishSwissSyrianTaiwaneseThaiTlingit-HaidaTohono O'OdhamTonganTrinidadian and TobagonianTsimshianTurkishU.S. Virgin IslanderUgandanUkrainianUruguayanUteVenezuelanVietnameseWelshWest IndianYakamaYaquiYugoslavianYumanYup'ikZimbabwean
Immigration
NonimmigrantsImmigrantsAfghanistanAfricaAlbaniaArgentinaArmeniaAsiaAustraliaAustriaBahamasBangladeshBarbadosBelarusBelgiumBelizeBoliviaBosnia and HerzegovinaBrazilBulgariaBurma/MyanmarCabo VerdeCambodiaCameroonCanadaCaribbeanCentral AmericaChileChinaColombiaCongoCosta RicaCroatiaCubaCzechoslovakiaDenmarkDominicaDominican RepublicEastern AfricaEastern AsiaEastern EuropeEcuadorEgyptEl SalvadorEnglandEritreaEthiopiaEuropeFijiFranceGermanyGhanaGreeceGrenadaGuatemalaGuyanaHaitiHondurasHong KongHungaryIndiaIndonesiaIranIraqIrelandIsraelItalyJamaicaJapanJordanKazakhstanKenyaKoreaKuwaitLaosLatin AmericaLatviaLebanonLiberiaLithuaniaMalaysiaMexicoMicronesiaMiddle AfricaMoldovaMoroccoNepalNetherlandsNicaraguaNigeriaNorth AmericaNorth MacedoniaNorthern AfricaNorthern EuropeNorwayOceaniaPakistanPanamaPeruPhilippinesPolandPortugalRomaniaRussiaSaudi ArabiaScotlandSenegalSerbiaSierra LeoneSingaporeSomaliaSouth AfricaSouth AmericaSouth Central AsiaSouth Eastern AsiaSouthern EuropeSpainSri LankaSt. Vincent and the GrenadinesSudanSwedenSwitzerlandSyriaTaiwanThailandTrinidad and TobagoTurkeyUgandaUkraineUruguayUzbekistanVenezuelaVietnamWest IndiesWestern AfricaWestern AsiaWestern EuropeYemenZaireZimbabweAzores
Japanese
Race
Ancestry
AfghanAfricanAlaska NativeAlaskan AthabascanAlbanianAleutAlsatianAmericanApacheArabArapahoArgentineanArmenianAssyrian/Chaldean/SyriacAustralianAustrianBahamianBangladeshiBarbadianBasqueBelgianBelizeanBermudanBhutaneseBlackfeetBolivianBrazilianBritishBritish West IndianBulgarianBurmeseCajunCambodianCanadianCape VerdeanCarpatho RusynCelticCentral AmericanCentral American IndianCherokeeCheyenneChickasawChileanChineseChippewaChoctawColombianColvilleComancheCosta RicanCreeCreekCroatianCrowCubanCypriotCzechCzechoslovakianDanishDelawareDominicanDutchDutch West IndianEastern EuropeanEcuadorianEgyptianEnglishEstonianEthiopianEuropeanFijianFilipinoFinnishFrenchFrench American IndianFrench CanadianGermanGerman RussianGhanaianGreekGuamanian/ChamorroGuatemalanGuyaneseHaitianHmongHonduranHopiHoumaIcelanderIndian (Asian)IndonesianInupiatIranianIraqiIrishIroquoisIsraeliItalianJamaicanJapaneseJordanianKenyanKiowaKoreanLaotianLatvianLebaneseLiberianLithuanianLumbeeLuxembourgerMacedonianMalaysianMalteseMarshalleseMenomineeMexicanMexican American IndianMongolianMoroccanNative HawaiianNavajoNepaleseNew ZealanderNicaraguanNigerianNorthern EuropeanNorwegianOkinawanOsageOttawaPaiutePakistaniPalestinianPanamanianParaguayanPennsylvania GermanPeruvianPimaPolishPortuguesePotawatomiPuebloPuerto RicanPuget Sound SalishRomanianRussianSalvadoranSamoanScandinavianScotch-IrishScottishSeminoleSenegaleseSerbianShoshoneSierra LeoneanSiouxSlavicSlovakSloveneSomaliSouth AfricanSouth AmericanSouth American IndianSoviet UnionSpaniardSpanishSpanish AmericanSpanish American IndianSri LankanSubsaharan AfricanSudaneseSwedishSwissSyrianTaiwaneseThaiTlingit-HaidaTohono O'OdhamTonganTrinidadian and TobagonianTsimshianTurkishU.S. Virgin IslanderUgandanUkrainianUruguayanUteVenezuelanVietnameseWelshWest IndianYakamaYaquiYugoslavianYumanYup'ikZimbabwean
Immigration
NonimmigrantsImmigrantsAfghanistanAfricaAlbaniaArgentinaArmeniaAsiaAustraliaAustriaBahamasBangladeshBarbadosBelarusBelgiumBelizeBoliviaBosnia and HerzegovinaBrazilBulgariaBurma/MyanmarCabo VerdeCambodiaCameroonCanadaCaribbeanCentral AmericaChileChinaColombiaCongoCosta RicaCroatiaCubaCzechoslovakiaDenmarkDominicaDominican RepublicEastern AfricaEastern AsiaEastern EuropeEcuadorEgyptEl SalvadorEnglandEritreaEthiopiaEuropeFijiFranceGermanyGhanaGreeceGrenadaGuatemalaGuyanaHaitiHondurasHong KongHungaryIndiaIndonesiaIranIraqIrelandIsraelItalyJamaicaJapanJordanKazakhstanKenyaKoreaKuwaitLaosLatin AmericaLatviaLebanonLiberiaLithuaniaMalaysiaMexicoMicronesiaMiddle AfricaMoldovaMoroccoNepalNetherlandsNicaraguaNigeriaNorth AmericaNorth MacedoniaNorthern AfricaNorthern EuropeNorwayOceaniaPakistanPanamaPeruPhilippinesPolandPortugalRomaniaRussiaSaudi ArabiaScotlandSenegalSerbiaSierra LeoneSingaporeSomaliaSouth AfricaSouth AmericaSouth Central AsiaSouth Eastern AsiaSouthern EuropeSpainSri LankaSt. Vincent and the GrenadinesSudanSwedenSwitzerlandSyriaTaiwanThailandTrinidad and TobagoTurkeyUgandaUkraineUruguayUzbekistanVenezuelaVietnamWest IndiesWestern AfricaWestern AsiaWestern EuropeYemenZaireZimbabweAzores
Single Mother Households
Income
Poverty
Unemployment
Labor Participation
Family Structure
Vehicle Availability
Education Level
Disability

Single Mother Households Comparison

Hungarians

Japanese

Exceptional
Tragic
5.7%
SINGLE MOTHER HOUSEHOLDS
97.6/ 100
METRIC RATING
85th/ 347
METRIC RANK
7.4%
SINGLE MOTHER HOUSEHOLDS
0.2/ 100
METRIC RATING
261st/ 347
METRIC RANK

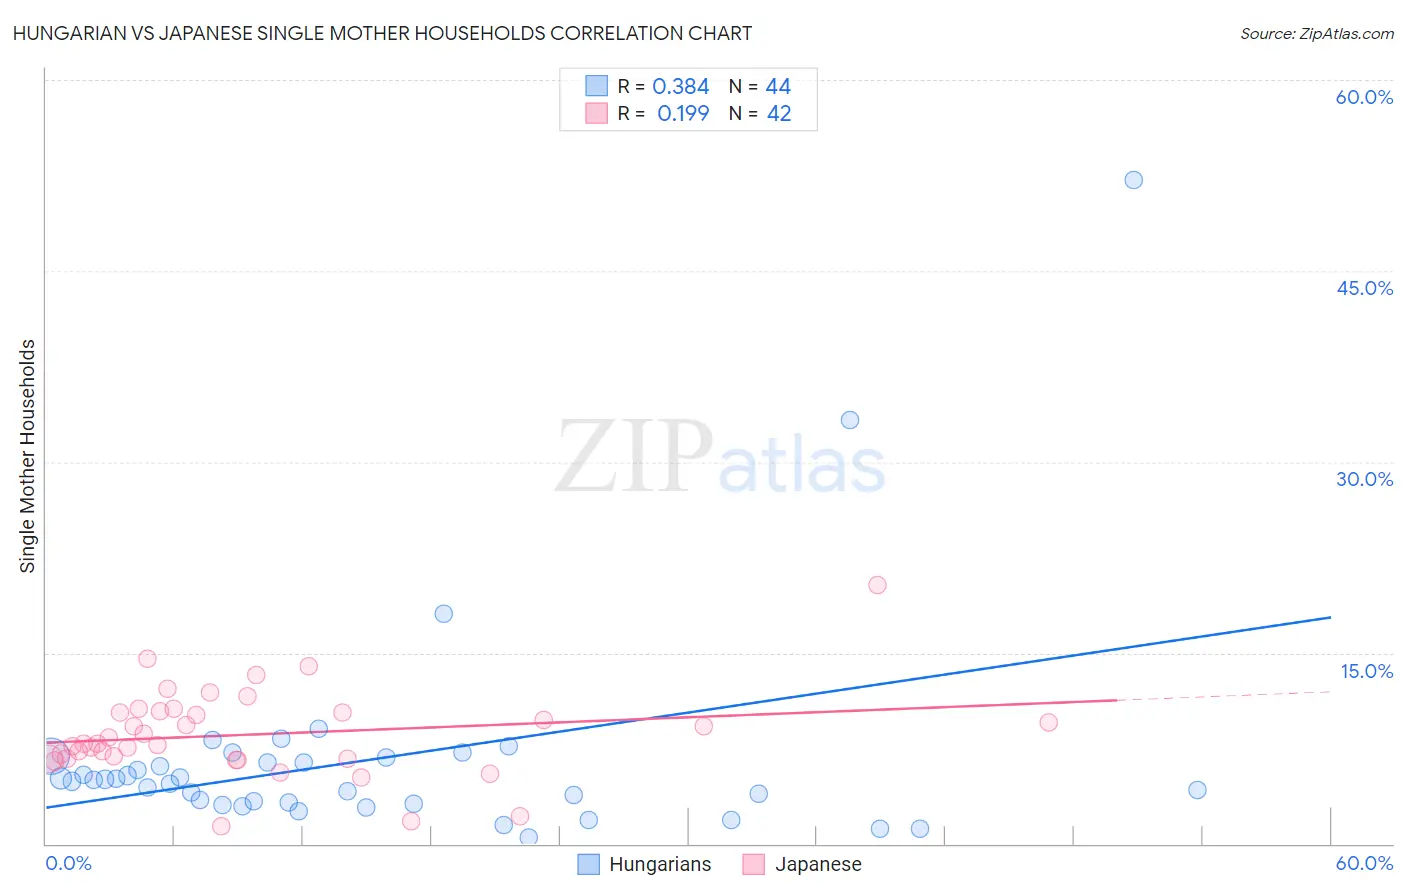
Hungarian vs Japanese Single Mother Households Correlation Chart

The statistical analysis conducted on geographies consisting of 483,597,168 people shows a mild positive correlation between the proportion of Hungarians and percentage of single mother households in the United States with a correlation coefficient (R) of 0.384 and weighted average of 5.7%. Similarly, the statistical analysis conducted on geographies consisting of 248,925,725 people shows a poor positive correlation between the proportion of Japanese and percentage of single mother households in the United States with a correlation coefficient (R) of 0.199 and weighted average of 7.4%, a difference of 30.5%.
Hungarian vs Japanese Single Mother Households

Single Mother Households Correlation Summary

MeasurementHungarianJapanese
Minimum0.48%1.3%
Maximum52.2%20.4%
Range51.7%19.0%
Mean6.6%8.6%
Median4.9%7.8%
Interquartile 25% (IQ1)3.2%6.7%
Interquartile 75% (IQ3)6.6%10.3%
Interquartile Range (IQR)3.4%3.6%
Standard Deviation (Sample)8.7%3.4%
Standard Deviation (Population)8.6%3.4%

Similar Demographics by Single Mother Households

Demographics Similar to Hungarians by Single Mother Households

In terms of single mother households, the demographic groups most similar to Hungarians are Finnish (5.7%, a difference of 0.030%), Immigrants from Turkey (5.7%, a difference of 0.11%), Carpatho Rusyn (5.7%, a difference of 0.15%), Israeli (5.7%, a difference of 0.18%), and Immigrants from Hungary (5.7%, a difference of 0.23%).
DemographicsRating | RankSingle Mother Households
Swiss
98.1
/100
|
#78
Exceptional
5.6%
Immigrants | Sri Lanka
98.0
/100
|
#79
Exceptional
5.6%
Czechs
97.9
/100
|
#80
Exceptional
5.6%
Immigrants | Moldova
97.9
/100
|
#81
Exceptional
5.6%
Immigrants | Malaysia
97.8
/100
|
#82
Exceptional
5.7%
Immigrants | Hungary
97.8
/100
|
#83
Exceptional
5.7%
Carpatho Rusyns
97.7
/100
|
#84
Exceptional
5.7%
Hungarians
97.6
/100
|
#85
Exceptional
5.7%
Finns
97.6
/100
|
#86
Exceptional
5.7%
Immigrants | Turkey
97.5
/100
|
#87
Exceptional
5.7%
Israelis
97.4
/100
|
#88
Exceptional
5.7%
Ukrainians
97.2
/100
|
#89
Exceptional
5.7%
Immigrants | Indonesia
97.2
/100
|
#90
Exceptional
5.7%
Europeans
97.0
/100
|
#91
Exceptional
5.7%
Immigrants | Western Asia
96.7
/100
|
#92
Exceptional
5.7%

Demographics Similar to Japanese by Single Mother Households

In terms of single mother households, the demographic groups most similar to Japanese are Immigrants from Zaire (7.4%, a difference of 0.020%), Immigrants from Yemen (7.4%, a difference of 0.060%), Pueblo (7.4%, a difference of 0.080%), Alaska Native (7.4%, a difference of 0.10%), and Seminole (7.4%, a difference of 0.15%).
DemographicsRating | RankSingle Mother Households
Immigrants | Ecuador
0.3
/100
|
#254
Tragic
7.3%
Mexican American Indians
0.2
/100
|
#255
Tragic
7.4%
Seminole
0.2
/100
|
#256
Tragic
7.4%
Alaska Natives
0.2
/100
|
#257
Tragic
7.4%
Pueblo
0.2
/100
|
#258
Tragic
7.4%
Immigrants | Yemen
0.2
/100
|
#259
Tragic
7.4%
Immigrants | Zaire
0.2
/100
|
#260
Tragic
7.4%
Japanese
0.2
/100
|
#261
Tragic
7.4%
Immigrants | Somalia
0.2
/100
|
#262
Tragic
7.4%
Immigrants | Nicaragua
0.2
/100
|
#263
Tragic
7.4%
Yaqui
0.1
/100
|
#264
Tragic
7.4%
Crow
0.1
/100
|
#265
Tragic
7.4%
Nepalese
0.1
/100
|
#266
Tragic
7.5%
Blackfeet
0.1
/100
|
#267
Tragic
7.5%
Indonesians
0.1
/100
|
#268
Tragic
7.5%