Hungarian vs Immigrants from Haiti Average Family Size

COMPARE

Hungarian
Race
Ancestry
AfghanAfricanAlaska NativeAlaskan AthabascanAlbanianAleutAlsatianAmericanApacheArabArapahoArgentineanArmenianAssyrian/Chaldean/SyriacAustralianAustrianBahamianBangladeshiBarbadianBasqueBelgianBelizeanBermudanBhutaneseBlackfeetBolivianBrazilianBritishBritish West IndianBulgarianBurmeseCajunCambodianCanadianCape VerdeanCarpatho RusynCelticCentral AmericanCentral American IndianCherokeeCheyenneChickasawChileanChineseChippewaChoctawColombianColvilleComancheCosta RicanCreeCreekCroatianCrowCubanCypriotCzechCzechoslovakianDanishDelawareDominicanDutchDutch West IndianEastern EuropeanEcuadorianEgyptianEnglishEstonianEthiopianEuropeanFijianFilipinoFinnishFrenchFrench American IndianFrench CanadianGermanGerman RussianGhanaianGreekGuamanian/ChamorroGuatemalanGuyaneseHaitianHmongHonduranHopiHoumaHungarianIcelanderIndian (Asian)IndonesianInupiatIranianIraqiIrishIroquoisIsraeliItalianJamaicanJapaneseJordanianKenyanKiowaKoreanLaotianLatvianLebaneseLiberianLithuanianLumbeeLuxembourgerMacedonianMalaysianMalteseMarshalleseMenomineeMexicanMexican American IndianMongolianMoroccanNative HawaiianNavajoNepaleseNew ZealanderNicaraguanNigerianNorthern EuropeanNorwegianOkinawanOsageOttawaPaiutePakistaniPalestinianPanamanianParaguayanPennsylvania GermanPeruvianPimaPolishPortuguesePotawatomiPuebloPuerto RicanPuget Sound SalishRomanianRussianSalvadoranSamoanScandinavianScotch-IrishScottishSeminoleSenegaleseSerbianShoshoneSierra LeoneanSiouxSlavicSlovakSloveneSomaliSouth AfricanSouth AmericanSouth American IndianSoviet UnionSpaniardSpanishSpanish AmericanSpanish American IndianSri LankanSubsaharan AfricanSudaneseSwedishSwissSyrianTaiwaneseThaiTlingit-HaidaTohono O'OdhamTonganTrinidadian and TobagonianTsimshianTurkishU.S. Virgin IslanderUgandanUkrainianUruguayanUteVenezuelanVietnameseWelshWest IndianYakamaYaquiYugoslavianYumanYup'ikZimbabwean
Immigration
NonimmigrantsImmigrantsAfghanistanAfricaAlbaniaArgentinaArmeniaAsiaAustraliaAustriaBahamasBangladeshBarbadosBelarusBelgiumBelizeBoliviaBosnia and HerzegovinaBrazilBulgariaBurma/MyanmarCabo VerdeCambodiaCameroonCanadaCaribbeanCentral AmericaChileChinaColombiaCongoCosta RicaCroatiaCubaCzechoslovakiaDenmarkDominicaDominican RepublicEastern AfricaEastern AsiaEastern EuropeEcuadorEgyptEl SalvadorEnglandEritreaEthiopiaEuropeFijiFranceGermanyGhanaGreeceGrenadaGuatemalaGuyanaHondurasHong KongHungaryIndiaIndonesiaIranIraqIrelandIsraelItalyJamaicaJapanJordanKazakhstanKenyaKoreaKuwaitLaosLatin AmericaLatviaLebanonLiberiaLithuaniaMalaysiaMexicoMicronesiaMiddle AfricaMoldovaMoroccoNepalNetherlandsNicaraguaNigeriaNorth AmericaNorth MacedoniaNorthern AfricaNorthern EuropeNorwayOceaniaPakistanPanamaPeruPhilippinesPolandPortugalRomaniaRussiaSaudi ArabiaScotlandSenegalSerbiaSierra LeoneSingaporeSomaliaSouth AfricaSouth AmericaSouth Central AsiaSouth Eastern AsiaSouthern EuropeSpainSri LankaSt. Vincent and the GrenadinesSudanSwedenSwitzerlandSyriaTaiwanThailandTrinidad and TobagoTurkeyUgandaUkraineUruguayUzbekistanVenezuelaVietnamWest IndiesWestern AfricaWestern AsiaWestern EuropeYemenZaireZimbabweAzores
Immigrants from Haiti
Race
Ancestry
AfghanAfricanAlaska NativeAlaskan AthabascanAlbanianAleutAlsatianAmericanApacheArabArapahoArgentineanArmenianAssyrian/Chaldean/SyriacAustralianAustrianBahamianBangladeshiBarbadianBasqueBelgianBelizeanBermudanBhutaneseBlackfeetBolivianBrazilianBritishBritish West IndianBulgarianBurmeseCajunCambodianCanadianCape VerdeanCarpatho RusynCelticCentral AmericanCentral American IndianCherokeeCheyenneChickasawChileanChineseChippewaChoctawColombianColvilleComancheCosta RicanCreeCreekCroatianCrowCubanCypriotCzechCzechoslovakianDanishDelawareDominicanDutchDutch West IndianEastern EuropeanEcuadorianEgyptianEnglishEstonianEthiopianEuropeanFijianFilipinoFinnishFrenchFrench American IndianFrench CanadianGermanGerman RussianGhanaianGreekGuamanian/ChamorroGuatemalanGuyaneseHaitianHmongHonduranHopiHoumaIcelanderIndian (Asian)IndonesianInupiatIranianIraqiIrishIroquoisIsraeliItalianJamaicanJapaneseJordanianKenyanKiowaKoreanLaotianLatvianLebaneseLiberianLithuanianLumbeeLuxembourgerMacedonianMalaysianMalteseMarshalleseMenomineeMexicanMexican American IndianMongolianMoroccanNative HawaiianNavajoNepaleseNew ZealanderNicaraguanNigerianNorthern EuropeanNorwegianOkinawanOsageOttawaPaiutePakistaniPalestinianPanamanianParaguayanPennsylvania GermanPeruvianPimaPolishPortuguesePotawatomiPuebloPuerto RicanPuget Sound SalishRomanianRussianSalvadoranSamoanScandinavianScotch-IrishScottishSeminoleSenegaleseSerbianShoshoneSierra LeoneanSiouxSlavicSlovakSloveneSomaliSouth AfricanSouth AmericanSouth American IndianSoviet UnionSpaniardSpanishSpanish AmericanSpanish American IndianSri LankanSubsaharan AfricanSudaneseSwedishSwissSyrianTaiwaneseThaiTlingit-HaidaTohono O'OdhamTonganTrinidadian and TobagonianTsimshianTurkishU.S. Virgin IslanderUgandanUkrainianUruguayanUteVenezuelanVietnameseWelshWest IndianYakamaYaquiYugoslavianYumanYup'ikZimbabwean
Immigration
NonimmigrantsImmigrantsAfghanistanAfricaAlbaniaArgentinaArmeniaAsiaAustraliaAustriaBahamasBangladeshBarbadosBelarusBelgiumBelizeBoliviaBosnia and HerzegovinaBrazilBulgariaBurma/MyanmarCabo VerdeCambodiaCameroonCanadaCaribbeanCentral AmericaChileChinaColombiaCongoCosta RicaCroatiaCubaCzechoslovakiaDenmarkDominicaDominican RepublicEastern AfricaEastern AsiaEastern EuropeEcuadorEgyptEl SalvadorEnglandEritreaEthiopiaEuropeFijiFranceGermanyGhanaGreeceGrenadaGuatemalaGuyanaHaitiHondurasHong KongHungaryIndiaIndonesiaIranIraqIrelandIsraelItalyJamaicaJapanJordanKazakhstanKenyaKoreaKuwaitLaosLatin AmericaLatviaLebanonLiberiaLithuaniaMalaysiaMexicoMicronesiaMiddle AfricaMoldovaMoroccoNepalNetherlandsNicaraguaNigeriaNorth AmericaNorth MacedoniaNorthern AfricaNorthern EuropeNorwayOceaniaPakistanPanamaPeruPhilippinesPolandPortugalRomaniaRussiaSaudi ArabiaScotlandSenegalSerbiaSierra LeoneSingaporeSomaliaSouth AfricaSouth AmericaSouth Central AsiaSouth Eastern AsiaSouthern EuropeSpainSri LankaSt. Vincent and the GrenadinesSudanSwedenSwitzerlandSyriaTaiwanThailandTrinidad and TobagoTurkeyUgandaUkraineUruguayUzbekistanVenezuelaVietnamWest IndiesWestern AfricaWestern AsiaWestern EuropeYemenZaireZimbabweAzores
Average Family Size
Income
Poverty
Unemployment
Labor Participation
Family Structure
Vehicle Availability
Education Level
Disability

Average Family Size Comparison

Hungarians

Immigrants from Haiti

Tragic
Exceptional
3.18
AVERAGE FAMILY SIZE
3.0/ 100
METRIC RATING
242nd/ 347
METRIC RANK
3.39
AVERAGE FAMILY SIZE
100.0/ 100
METRIC RATING
39th/ 347
METRIC RANK

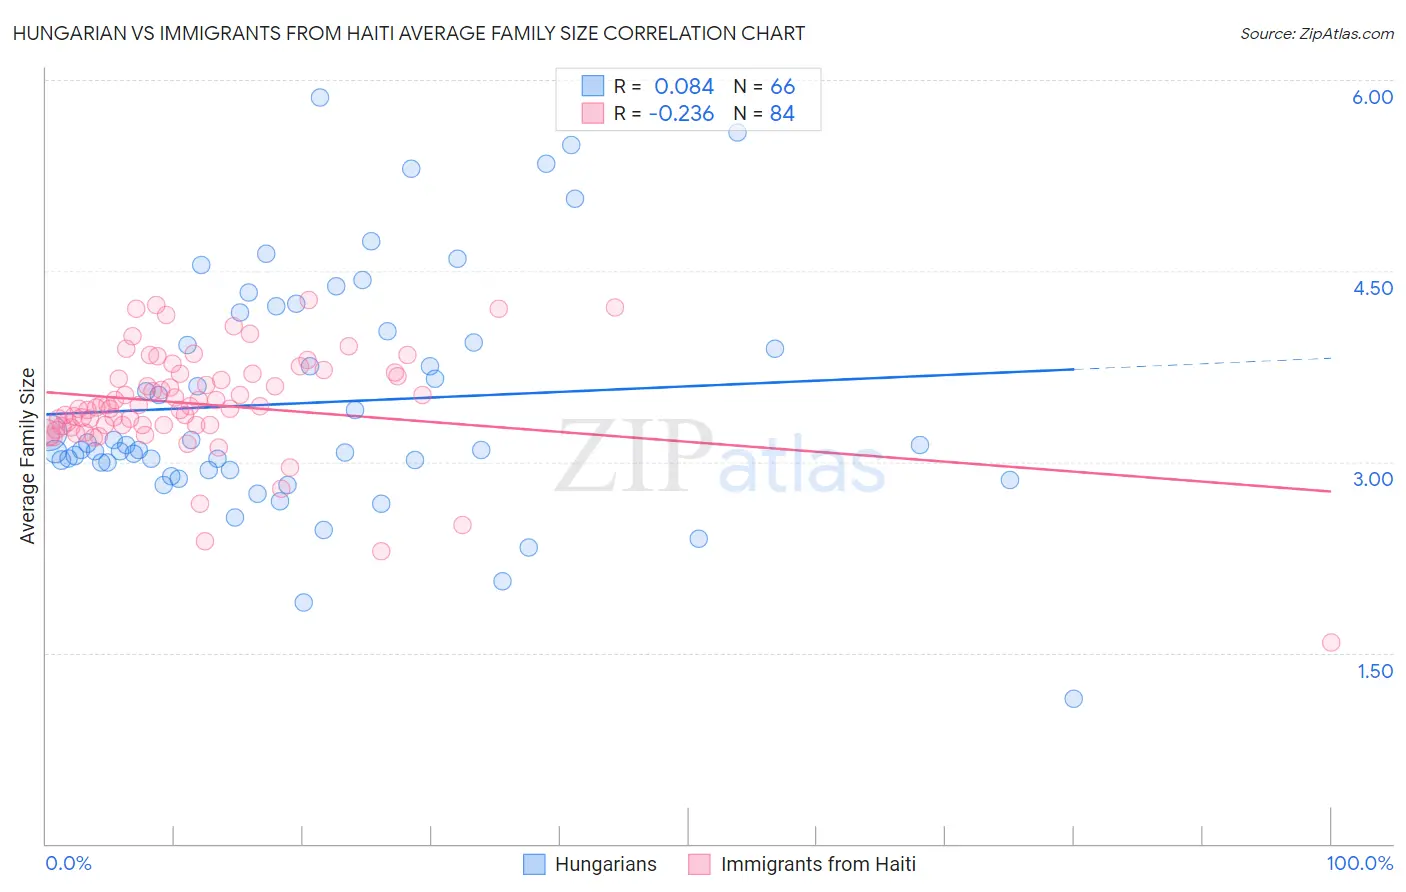
Hungarian vs Immigrants from Haiti Average Family Size Correlation Chart

The statistical analysis conducted on geographies consisting of 485,906,700 people shows a slight positive correlation between the proportion of Hungarians and average family size in the United States with a correlation coefficient (R) of 0.084 and weighted average of 3.18. Similarly, the statistical analysis conducted on geographies consisting of 225,178,087 people shows a weak negative correlation between the proportion of Immigrants from Haiti and average family size in the United States with a correlation coefficient (R) of -0.236 and weighted average of 3.39, a difference of 6.7%.
Hungarian vs Immigrants from Haiti Average Family Size

Average Family Size Correlation Summary

MeasurementHungarianImmigrants from Haiti
Minimum1.141.58
Maximum5.864.27
Range4.722.69
Mean3.473.45
Median3.113.44
Interquartile 25% (IQ1)2.943.29
Interquartile 75% (IQ3)4.033.69
Interquartile Range (IQR)1.090.40
Standard Deviation (Sample)0.930.43
Standard Deviation (Population)0.920.43

Similar Demographics by Average Family Size

Demographics Similar to Hungarians by Average Family Size

In terms of average family size, the demographic groups most similar to Hungarians are Immigrants from Moldova (3.18, a difference of 0.0%), Immigrants from Southern Europe (3.18, a difference of 0.010%), Immigrants from Japan (3.18, a difference of 0.020%), Osage (3.18, a difference of 0.040%), and Immigrants from Brazil (3.18, a difference of 0.040%).
DemographicsRating | RankAverage Family Size
Immigrants | Turkey
4.2
/100
|
#235
Tragic
3.18
Immigrants | Portugal
4.2
/100
|
#236
Tragic
3.18
Immigrants | Romania
3.7
/100
|
#237
Tragic
3.18
Romanians
3.7
/100
|
#238
Tragic
3.18
Houma
3.4
/100
|
#239
Tragic
3.18
Osage
3.2
/100
|
#240
Tragic
3.18
Immigrants | Japan
3.0
/100
|
#241
Tragic
3.18
Hungarians
3.0
/100
|
#242
Tragic
3.18
Immigrants | Moldova
2.9
/100
|
#243
Tragic
3.18
Immigrants | Southern Europe
2.9
/100
|
#244
Tragic
3.18
Immigrants | Brazil
2.7
/100
|
#245
Tragic
3.18
Danes
2.5
/100
|
#246
Tragic
3.17
Cajuns
2.4
/100
|
#247
Tragic
3.17
Immigrants | Belarus
2.3
/100
|
#248
Tragic
3.17
Immigrants | Eastern Europe
2.1
/100
|
#249
Tragic
3.17

Demographics Similar to Immigrants from Haiti by Average Family Size

In terms of average family size, the demographic groups most similar to Immigrants from Haiti are Immigrants from Belize (3.39, a difference of 0.080%), Belizean (3.39, a difference of 0.12%), Guyanese (3.40, a difference of 0.24%), Marshallese (3.38, a difference of 0.29%), and Immigrants from Vietnam (3.38, a difference of 0.35%).
DemographicsRating | RankAverage Family Size
Immigrants | Guatemala
100.0
/100
|
#32
Exceptional
3.41
Hawaiians
100.0
/100
|
#33
Exceptional
3.41
Hispanics or Latinos
100.0
/100
|
#34
Exceptional
3.41
Guatemalans
100.0
/100
|
#35
Exceptional
3.40
Immigrants | Guyana
100.0
/100
|
#36
Exceptional
3.40
Guyanese
100.0
/100
|
#37
Exceptional
3.40
Immigrants | Belize
100.0
/100
|
#38
Exceptional
3.39
Immigrants | Haiti
100.0
/100
|
#39
Exceptional
3.39
Belizeans
100.0
/100
|
#40
Exceptional
3.39
Marshallese
100.0
/100
|
#41
Exceptional
3.38
Immigrants | Vietnam
100.0
/100
|
#42
Exceptional
3.38
Immigrants | Philippines
100.0
/100
|
#43
Exceptional
3.37
Alaska Natives
100.0
/100
|
#44
Exceptional
3.37
Shoshone
100.0
/100
|
#45
Exceptional
3.37
Haitians
100.0
/100
|
#46
Exceptional
3.37