Houma vs Bermudan Currently Married
COMPARE
Houma
Bermudan
Currently Married
Currently Married Comparison
Houma
Bermudans
45.5%
CURRENTLY MARRIED
7.2/ 100
METRIC RATING
211th/ 347
METRIC RANK
43.5%
CURRENTLY MARRIED
0.1/ 100
METRIC RATING
271st/ 347
METRIC RANK
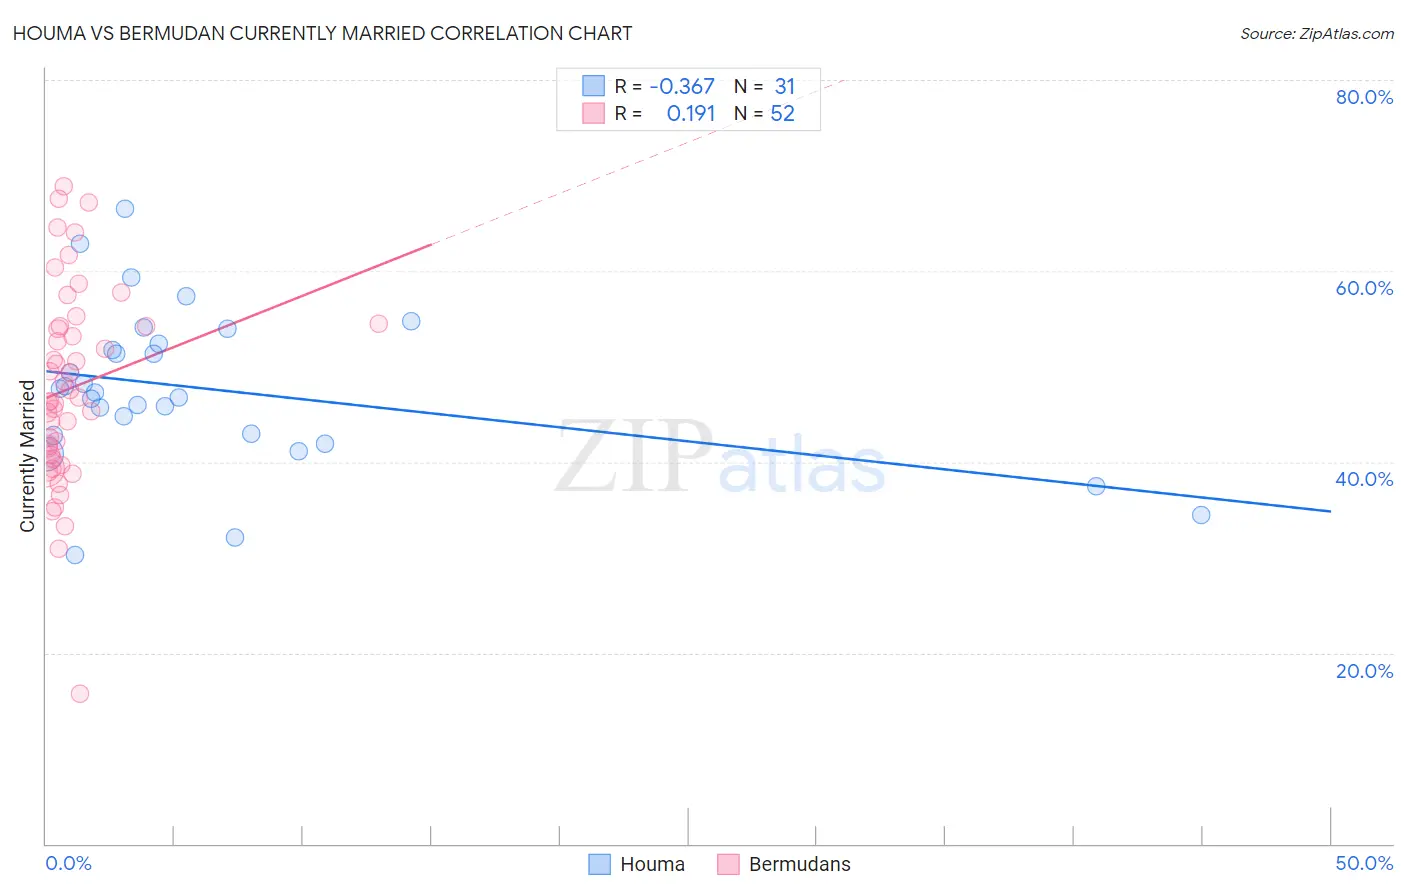
Houma vs Bermudan Currently Married Correlation Chart
The statistical analysis conducted on geographies consisting of 36,796,778 people shows a mild negative correlation between the proportion of Houma and percentage of population currently married in the United States with a correlation coefficient (R) of -0.367 and weighted average of 45.5%. Similarly, the statistical analysis conducted on geographies consisting of 55,732,325 people shows a poor positive correlation between the proportion of Bermudans and percentage of population currently married in the United States with a correlation coefficient (R) of 0.191 and weighted average of 43.5%, a difference of 4.7%.
Currently Married Correlation Summary
| Measurement | Houma | Bermudan |
| Minimum | 30.2% | 15.7% |
| Maximum | 66.5% | 68.9% |
| Range | 36.3% | 53.2% |
| Mean | 47.6% | 47.7% |
| Median | 47.3% | 46.6% |
| Interquartile 25% (IQ1) | 42.8% | 40.5% |
| Interquartile 75% (IQ3) | 52.4% | 54.2% |
| Interquartile Range (IQR) | 9.6% | 13.7% |
| Standard Deviation (Sample) | 8.2% | 10.4% |
| Standard Deviation (Population) | 8.1% | 10.3% |
Similar Demographics by Currently Married
Demographics Similar to Houma by Currently Married
In terms of currently married, the demographic groups most similar to Houma are Marshallese (45.5%, a difference of 0.010%), Alaska Native (45.5%, a difference of 0.040%), Dutch West Indian (45.5%, a difference of 0.080%), German Russian (45.5%, a difference of 0.080%), and Uruguayan (45.6%, a difference of 0.090%).
| Demographics | Rating | Rank | Currently Married |
| Immigrants | Spain | 11.6 /100 | #204 | Poor 45.8% |
| South American Indians | 11.5 /100 | #205 | Poor 45.8% |
| Immigrants | Immigrants | 11.2 /100 | #206 | Poor 45.8% |
| Immigrants | South America | 10.8 /100 | #207 | Poor 45.7% |
| Alsatians | 10.8 /100 | #208 | Poor 45.7% |
| Immigrants | Micronesia | 8.8 /100 | #209 | Tragic 45.6% |
| Uruguayans | 7.9 /100 | #210 | Tragic 45.6% |
| Houma | 7.2 /100 | #211 | Tragic 45.5% |
| Marshallese | 7.2 /100 | #212 | Tragic 45.5% |
| Alaska Natives | 7.0 /100 | #213 | Tragic 45.5% |
| Dutch West Indians | 6.7 /100 | #214 | Tragic 45.5% |
| German Russians | 6.7 /100 | #215 | Tragic 45.5% |
| Immigrants | Morocco | 5.5 /100 | #216 | Tragic 45.4% |
| Immigrants | Thailand | 5.1 /100 | #217 | Tragic 45.4% |
| Panamanians | 4.0 /100 | #218 | Tragic 45.3% |
Demographics Similar to Bermudans by Currently Married
In terms of currently married, the demographic groups most similar to Bermudans are Salvadoran (43.5%, a difference of 0.020%), Indonesian (43.5%, a difference of 0.040%), Yaqui (43.4%, a difference of 0.080%), Immigrants from Sudan (43.5%, a difference of 0.090%), and Nigerian (43.4%, a difference of 0.10%).
| Demographics | Rating | Rank | Currently Married |
| Sudanese | 0.1 /100 | #264 | Tragic 43.7% |
| Immigrants | Bangladesh | 0.1 /100 | #265 | Tragic 43.6% |
| Ecuadorians | 0.1 /100 | #266 | Tragic 43.6% |
| Immigrants | Eritrea | 0.1 /100 | #267 | Tragic 43.6% |
| Spanish American Indians | 0.1 /100 | #268 | Tragic 43.6% |
| Immigrants | Sudan | 0.1 /100 | #269 | Tragic 43.5% |
| Salvadorans | 0.1 /100 | #270 | Tragic 43.5% |
| Bermudans | 0.1 /100 | #271 | Tragic 43.5% |
| Indonesians | 0.1 /100 | #272 | Tragic 43.5% |
| Yaqui | 0.1 /100 | #273 | Tragic 43.4% |
| Nigerians | 0.1 /100 | #274 | Tragic 43.4% |
| Colville | 0.1 /100 | #275 | Tragic 43.4% |
| Sierra Leoneans | 0.1 /100 | #276 | Tragic 43.4% |
| Immigrants | Nigeria | 0.1 /100 | #277 | Tragic 43.4% |
| Central Americans | 0.0 /100 | #278 | Tragic 43.3% |