Hopi vs Australian Single Father Households
COMPARE
Hopi
Australian
Single Father Households
Single Father Households Comparison
Hopi
Australians
2.8%
SINGLE FATHER HOUSEHOLDS
0.0/ 100
METRIC RATING
307th/ 347
METRIC RANK
2.2%
SINGLE FATHER HOUSEHOLDS
97.7/ 100
METRIC RATING
120th/ 347
METRIC RANK
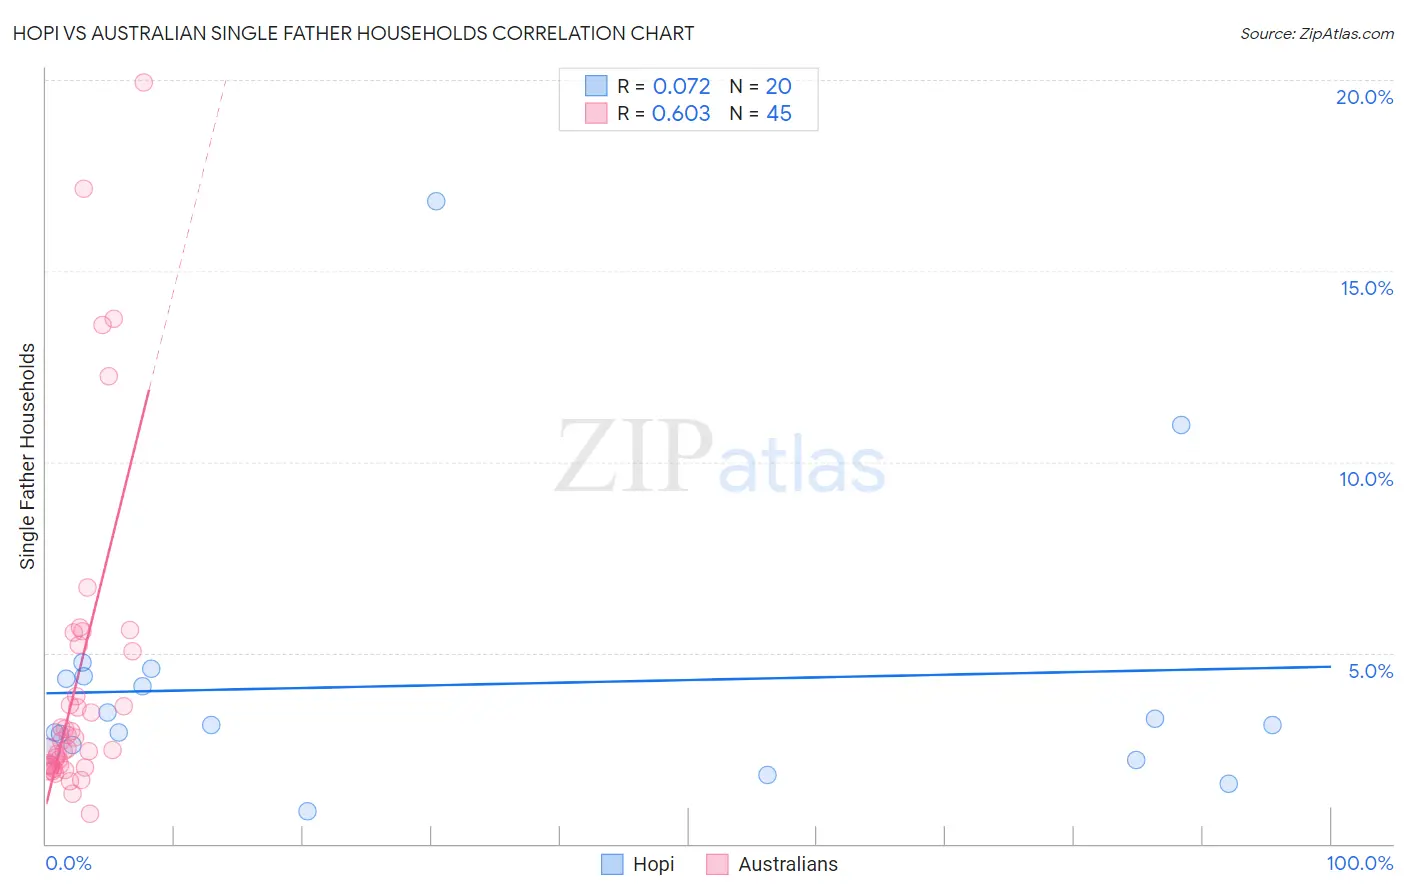
Hopi vs Australian Single Father Households Correlation Chart
The statistical analysis conducted on geographies consisting of 74,602,618 people shows a slight positive correlation between the proportion of Hopi and percentage of single father households in the United States with a correlation coefficient (R) of 0.072 and weighted average of 2.8%. Similarly, the statistical analysis conducted on geographies consisting of 222,691,289 people shows a significant positive correlation between the proportion of Australians and percentage of single father households in the United States with a correlation coefficient (R) of 0.603 and weighted average of 2.2%, a difference of 30.0%.
Single Father Households Correlation Summary
| Measurement | Hopi | Australian |
| Minimum | 0.84% | 0.78% |
| Maximum | 16.8% | 19.9% |
| Range | 16.0% | 19.2% |
| Mean | 4.2% | 4.3% |
| Median | 3.1% | 2.7% |
| Interquartile 25% (IQ1) | 2.5% | 2.0% |
| Interquartile 75% (IQ3) | 4.4% | 5.1% |
| Interquartile Range (IQR) | 1.9% | 3.1% |
| Standard Deviation (Sample) | 3.6% | 4.3% |
| Standard Deviation (Population) | 3.5% | 4.2% |
Similar Demographics by Single Father Households
Demographics Similar to Hopi by Single Father Households
In terms of single father households, the demographic groups most similar to Hopi are Immigrants from the Azores (2.8%, a difference of 0.17%), Apache (2.8%, a difference of 0.18%), Hispanic or Latino (2.8%, a difference of 0.32%), Mexican American Indian (2.8%, a difference of 0.48%), and Immigrants from Honduras (2.8%, a difference of 0.79%).
| Demographics | Rating | Rank | Single Father Households |
| Kiowa | 0.0 /100 | #300 | Tragic 2.8% |
| Immigrants | Latin America | 0.0 /100 | #301 | Tragic 2.8% |
| Spanish Americans | 0.0 /100 | #302 | Tragic 2.8% |
| Immigrants | Honduras | 0.0 /100 | #303 | Tragic 2.8% |
| Mexican American Indians | 0.0 /100 | #304 | Tragic 2.8% |
| Hispanics or Latinos | 0.0 /100 | #305 | Tragic 2.8% |
| Immigrants | Azores | 0.0 /100 | #306 | Tragic 2.8% |
| Hopi | 0.0 /100 | #307 | Tragic 2.8% |
| Apache | 0.0 /100 | #308 | Tragic 2.8% |
| Central Americans | 0.0 /100 | #309 | Tragic 2.9% |
| Immigrants | Laos | 0.0 /100 | #310 | Tragic 2.9% |
| Spanish American Indians | 0.0 /100 | #311 | Tragic 2.9% |
| Tsimshian | 0.0 /100 | #312 | Tragic 2.9% |
| Arapaho | 0.0 /100 | #313 | Tragic 2.9% |
| Salvadorans | 0.0 /100 | #314 | Tragic 2.9% |
Demographics Similar to Australians by Single Father Households
In terms of single father households, the demographic groups most similar to Australians are Immigrants from Brazil (2.2%, a difference of 0.0%), Trinidadian and Tobagonian (2.2%, a difference of 0.030%), Immigrants from Morocco (2.2%, a difference of 0.090%), Immigrants from Iraq (2.2%, a difference of 0.10%), and Hungarian (2.2%, a difference of 0.19%).
| Demographics | Rating | Rank | Single Father Households |
| Iraqis | 98.2 /100 | #113 | Exceptional 2.2% |
| Immigrants | North America | 98.2 /100 | #114 | Exceptional 2.2% |
| Immigrants | Barbados | 98.2 /100 | #115 | Exceptional 2.2% |
| Immigrants | Argentina | 98.1 /100 | #116 | Exceptional 2.2% |
| Hungarians | 97.9 /100 | #117 | Exceptional 2.2% |
| Immigrants | Morocco | 97.8 /100 | #118 | Exceptional 2.2% |
| Trinidadians and Tobagonians | 97.8 /100 | #119 | Exceptional 2.2% |
| Australians | 97.7 /100 | #120 | Exceptional 2.2% |
| Immigrants | Brazil | 97.7 /100 | #121 | Exceptional 2.2% |
| Immigrants | Iraq | 97.6 /100 | #122 | Exceptional 2.2% |
| Immigrants | Yemen | 97.5 /100 | #123 | Exceptional 2.2% |
| British West Indians | 97.4 /100 | #124 | Exceptional 2.2% |
| Immigrants | Indonesia | 97.4 /100 | #125 | Exceptional 2.2% |
| Moroccans | 96.9 /100 | #126 | Exceptional 2.2% |
| Jordanians | 96.9 /100 | #127 | Exceptional 2.2% |