Honduran vs Yakama Births to Unmarried Women
COMPARE
Honduran
Yakama
Births to Unmarried Women
Births to Unmarried Women Comparison
Hondurans
Yakama
38.7%
BIRTHS TO UNMARRIED WOMEN
0.0/ 100
METRIC RATING
302nd/ 347
METRIC RANK
40.3%
BIRTHS TO UNMARRIED WOMEN
0.0/ 100
METRIC RATING
319th/ 347
METRIC RANK
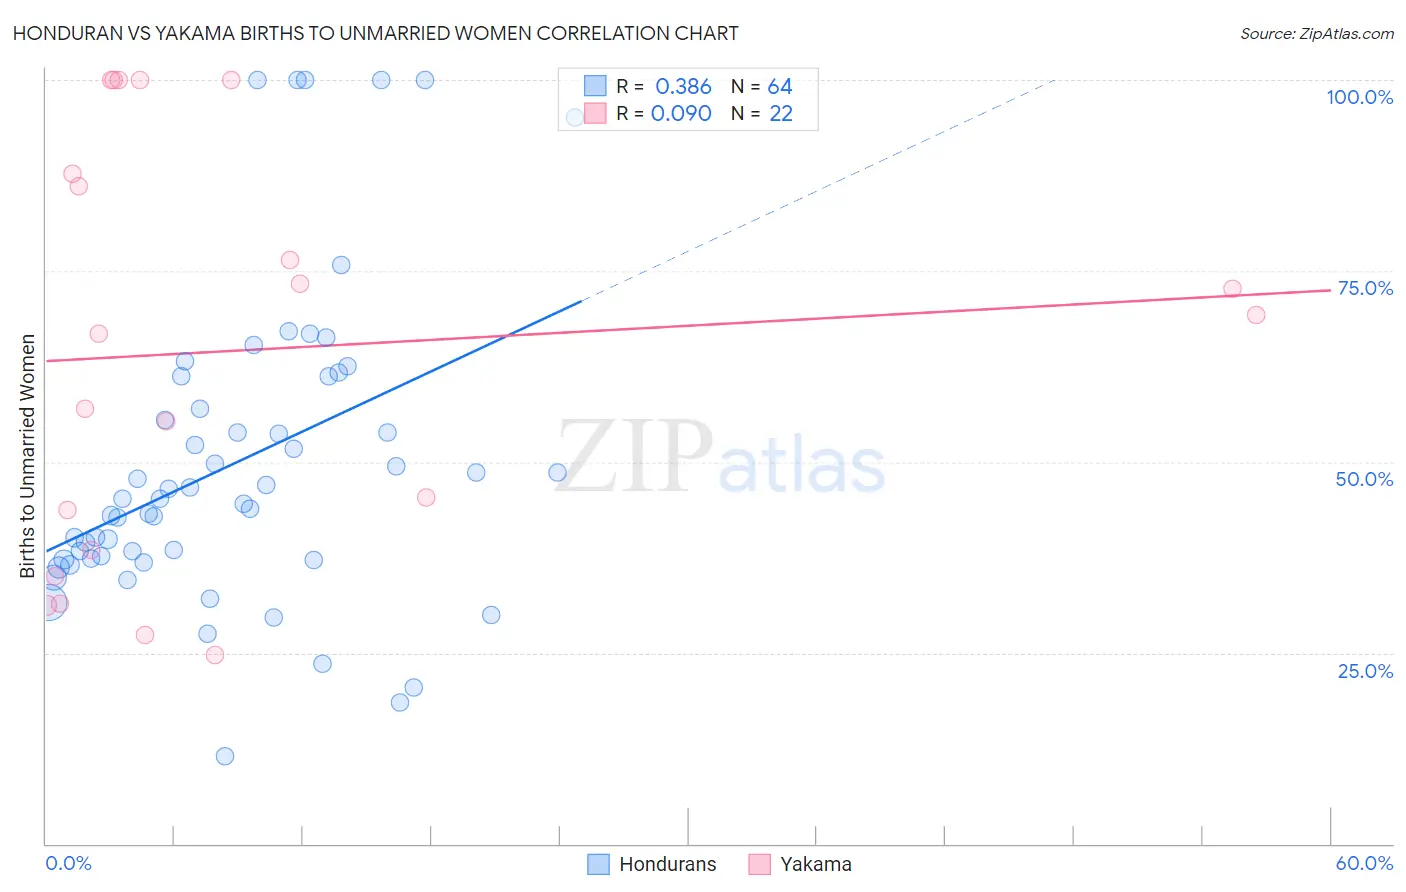
Honduran vs Yakama Births to Unmarried Women Correlation Chart
The statistical analysis conducted on geographies consisting of 342,571,212 people shows a mild positive correlation between the proportion of Hondurans and percentage of births to unmarried women in the United States with a correlation coefficient (R) of 0.386 and weighted average of 38.7%. Similarly, the statistical analysis conducted on geographies consisting of 19,190,199 people shows a slight positive correlation between the proportion of Yakama and percentage of births to unmarried women in the United States with a correlation coefficient (R) of 0.090 and weighted average of 40.3%, a difference of 4.3%.
Births to Unmarried Women Correlation Summary
| Measurement | Honduran | Yakama |
| Minimum | 11.5% | 24.7% |
| Maximum | 100.0% | 100.0% |
| Range | 88.5% | 75.3% |
| Mean | 49.8% | 64.6% |
| Median | 45.2% | 67.9% |
| Interquartile 25% (IQ1) | 37.3% | 38.5% |
| Interquartile 75% (IQ3) | 59.0% | 87.8% |
| Interquartile Range (IQR) | 21.8% | 49.3% |
| Standard Deviation (Sample) | 20.3% | 27.0% |
| Standard Deviation (Population) | 20.1% | 26.3% |
Demographics Similar to Hondurans and Yakama by Births to Unmarried Women
In terms of births to unmarried women, the demographic groups most similar to Hondurans are Haitian (38.6%, a difference of 0.24%), Immigrants from West Indies (38.6%, a difference of 0.25%), Immigrants from Jamaica (38.8%, a difference of 0.32%), Yaqui (38.8%, a difference of 0.37%), and Immigrants from Haiti (38.9%, a difference of 0.47%). Similarly, the demographic groups most similar to Yakama are Crow (40.4%, a difference of 0.060%), Immigrants from Bahamas (40.1%, a difference of 0.56%), Immigrants from Dominican Republic (40.1%, a difference of 0.62%), Apache (39.9%, a difference of 1.2%), and Dominican (39.8%, a difference of 1.2%).
| Demographics | Rating | Rank | Births to Unmarried Women |
| Immigrants | West Indies | 0.0 /100 | #300 | Tragic 38.6% |
| Haitians | 0.0 /100 | #301 | Tragic 38.6% |
| Hondurans | 0.0 /100 | #302 | Tragic 38.7% |
| Immigrants | Jamaica | 0.0 /100 | #303 | Tragic 38.8% |
| Yaqui | 0.0 /100 | #304 | Tragic 38.8% |
| Immigrants | Haiti | 0.0 /100 | #305 | Tragic 38.9% |
| Central American Indians | 0.0 /100 | #306 | Tragic 39.0% |
| Immigrants | Honduras | 0.0 /100 | #307 | Tragic 39.3% |
| Aleuts | 0.0 /100 | #308 | Tragic 39.3% |
| Cubans | 0.0 /100 | #309 | Tragic 39.4% |
| Immigrants | Dominica | 0.0 /100 | #310 | Tragic 39.5% |
| Immigrants | Azores | 0.0 /100 | #311 | Tragic 39.6% |
| U.S. Virgin Islanders | 0.0 /100 | #312 | Tragic 39.6% |
| Africans | 0.0 /100 | #313 | Tragic 39.7% |
| Immigrants | Caribbean | 0.0 /100 | #314 | Tragic 39.8% |
| Dominicans | 0.0 /100 | #315 | Tragic 39.8% |
| Apache | 0.0 /100 | #316 | Tragic 39.9% |
| Immigrants | Dominican Republic | 0.0 /100 | #317 | Tragic 40.1% |
| Immigrants | Bahamas | 0.0 /100 | #318 | Tragic 40.1% |
| Yakama | 0.0 /100 | #319 | Tragic 40.3% |
| Crow | 0.0 /100 | #320 | Tragic 40.4% |