Hmong vs Immigrants from Grenada Divorced or Separated
COMPARE
Hmong
Immigrants from Grenada
Divorced or Separated
Divorced or Separated Comparison
Hmong
Immigrants from Grenada
12.3%
DIVORCED OR SEPARATED
8.8/ 100
METRIC RATING
227th/ 347
METRIC RANK
11.9%
DIVORCED OR SEPARATED
79.1/ 100
METRIC RATING
146th/ 347
METRIC RANK
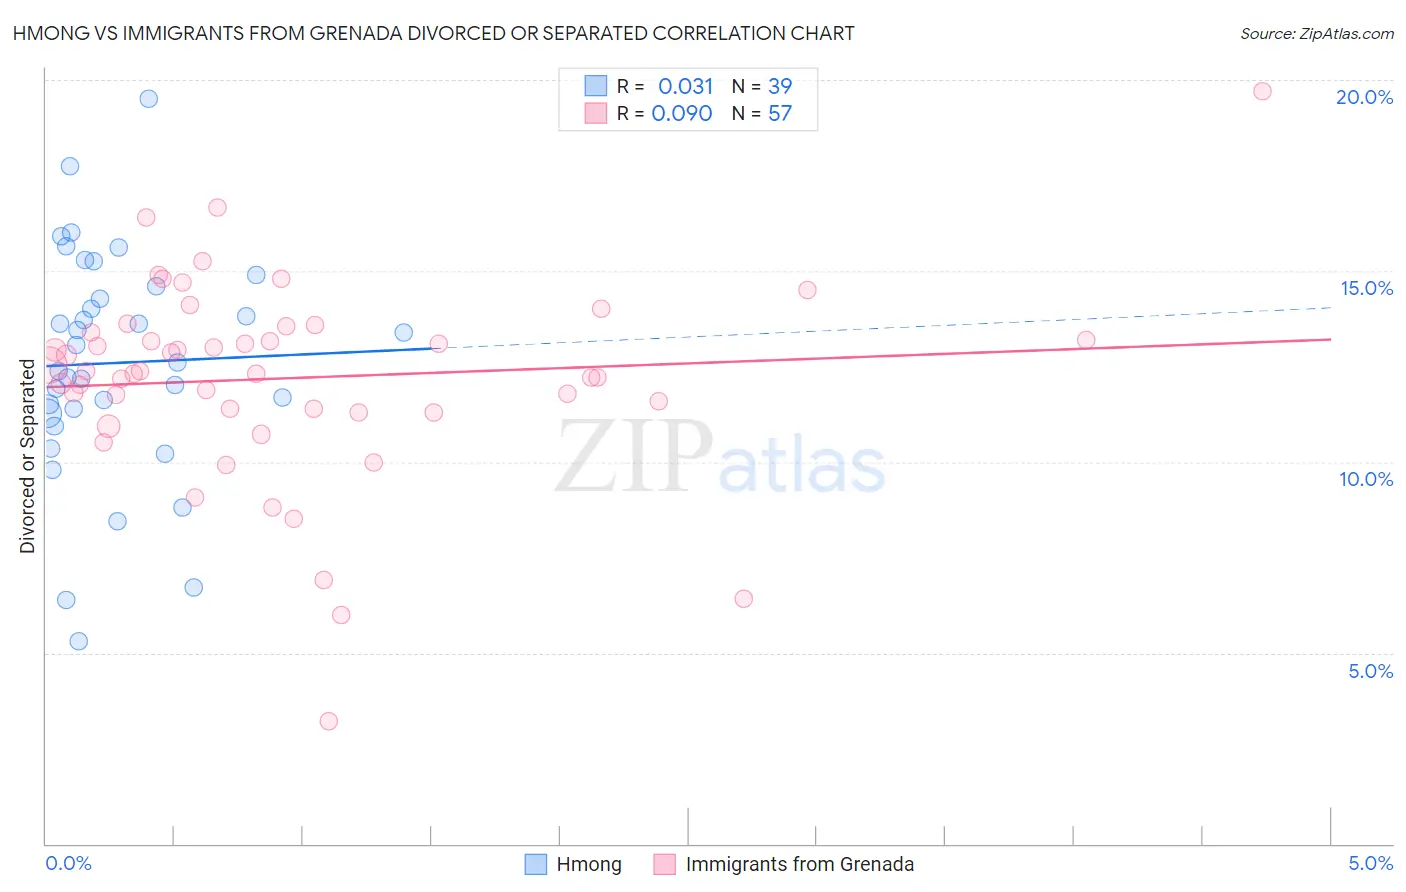
Hmong vs Immigrants from Grenada Divorced or Separated Correlation Chart
The statistical analysis conducted on geographies consisting of 24,678,157 people shows no correlation between the proportion of Hmong and percentage of population currently divorced or separated in the United States with a correlation coefficient (R) of 0.031 and weighted average of 12.3%. Similarly, the statistical analysis conducted on geographies consisting of 67,194,278 people shows a slight positive correlation between the proportion of Immigrants from Grenada and percentage of population currently divorced or separated in the United States with a correlation coefficient (R) of 0.090 and weighted average of 11.9%, a difference of 3.2%.
Divorced or Separated Correlation Summary
| Measurement | Hmong | Immigrants from Grenada |
| Minimum | 5.3% | 3.2% |
| Maximum | 19.5% | 19.7% |
| Range | 14.2% | 16.5% |
| Mean | 12.6% | 12.2% |
| Median | 12.6% | 12.4% |
| Interquartile 25% (IQ1) | 11.3% | 11.3% |
| Interquartile 75% (IQ3) | 14.6% | 13.5% |
| Interquartile Range (IQR) | 3.3% | 2.1% |
| Standard Deviation (Sample) | 3.0% | 2.7% |
| Standard Deviation (Population) | 2.9% | 2.6% |
Similar Demographics by Divorced or Separated
Demographics Similar to Hmong by Divorced or Separated
In terms of divorced or separated, the demographic groups most similar to Hmong are Immigrants from Western Africa (12.3%, a difference of 0.050%), Immigrants from Cameroon (12.3%, a difference of 0.050%), Immigrants from Sudan (12.3%, a difference of 0.070%), Immigrants from the Azores (12.3%, a difference of 0.090%), and Belgian (12.3%, a difference of 0.090%).
| Demographics | Rating | Rank | Divorced or Separated |
| British | 11.6 /100 | #220 | Poor 12.3% |
| Guamanians/Chamorros | 11.3 /100 | #221 | Poor 12.3% |
| Bangladeshis | 10.5 /100 | #222 | Poor 12.3% |
| Scandinavians | 10.4 /100 | #223 | Poor 12.3% |
| Immigrants | Azores | 9.7 /100 | #224 | Tragic 12.3% |
| Belgians | 9.7 /100 | #225 | Tragic 12.3% |
| Immigrants | Western Africa | 9.3 /100 | #226 | Tragic 12.3% |
| Hmong | 8.8 /100 | #227 | Tragic 12.3% |
| Immigrants | Cameroon | 8.3 /100 | #228 | Tragic 12.3% |
| Immigrants | Sudan | 8.2 /100 | #229 | Tragic 12.3% |
| Yakama | 7.8 /100 | #230 | Tragic 12.3% |
| Yugoslavians | 6.6 /100 | #231 | Tragic 12.3% |
| Canadians | 5.3 /100 | #232 | Tragic 12.4% |
| Malaysians | 4.8 /100 | #233 | Tragic 12.4% |
| West Indians | 4.4 /100 | #234 | Tragic 12.4% |
Demographics Similar to Immigrants from Grenada by Divorced or Separated
In terms of divorced or separated, the demographic groups most similar to Immigrants from Grenada are Polish (11.9%, a difference of 0.030%), Italian (11.9%, a difference of 0.070%), Immigrants from Oceania (11.9%, a difference of 0.070%), Croatian (11.9%, a difference of 0.080%), and Immigrants from Portugal (11.9%, a difference of 0.090%).
| Demographics | Rating | Rank | Divorced or Separated |
| Australians | 83.6 /100 | #139 | Excellent 11.9% |
| Lebanese | 83.4 /100 | #140 | Excellent 11.9% |
| Immigrants | Morocco | 82.9 /100 | #141 | Excellent 11.9% |
| Immigrants | Zimbabwe | 81.5 /100 | #142 | Excellent 11.9% |
| Pakistanis | 81.3 /100 | #143 | Excellent 11.9% |
| Peruvians | 80.9 /100 | #144 | Excellent 11.9% |
| Croatians | 80.6 /100 | #145 | Excellent 11.9% |
| Immigrants | Grenada | 79.1 /100 | #146 | Good 11.9% |
| Poles | 78.6 /100 | #147 | Good 11.9% |
| Italians | 77.8 /100 | #148 | Good 11.9% |
| Immigrants | Oceania | 77.7 /100 | #149 | Good 11.9% |
| Immigrants | Portugal | 77.3 /100 | #150 | Good 11.9% |
| Czechs | 76.4 /100 | #151 | Good 11.9% |
| Immigrants | Hungary | 73.7 /100 | #152 | Good 11.9% |
| Austrians | 72.2 /100 | #153 | Good 12.0% |