Hispanic or Latino vs Paraguayan Average Family Size

COMPARE

Hispanic or Latino
Race
Ancestry
AfghanAfricanAlaska NativeAlaskan AthabascanAlbanianAleutAlsatianAmericanApacheArabArapahoArgentineanArmenianAssyrian/Chaldean/SyriacAustralianAustrianBahamianBangladeshiBarbadianBasqueBelgianBelizeanBermudanBhutaneseBlackfeetBolivianBrazilianBritishBritish West IndianBulgarianBurmeseCajunCambodianCanadianCape VerdeanCarpatho RusynCelticCentral AmericanCentral American IndianCherokeeCheyenneChickasawChileanChineseChippewaChoctawColombianColvilleComancheCosta RicanCreeCreekCroatianCrowCubanCypriotCzechCzechoslovakianDanishDelawareDominicanDutchDutch West IndianEastern EuropeanEcuadorianEgyptianEnglishEstonianEthiopianEuropeanFijianFilipinoFinnishFrenchFrench American IndianFrench CanadianGermanGerman RussianGhanaianGreekGuamanian/ChamorroGuatemalanGuyaneseHaitianHmongHonduranHopiHoumaHungarianIcelanderIndian (Asian)IndonesianInupiatIranianIraqiIrishIroquoisIsraeliItalianJamaicanJapaneseJordanianKenyanKiowaKoreanLaotianLatvianLebaneseLiberianLithuanianLumbeeLuxembourgerMacedonianMalaysianMalteseMarshalleseMenomineeMexicanMexican American IndianMongolianMoroccanNative HawaiianNavajoNepaleseNew ZealanderNicaraguanNigerianNorthern EuropeanNorwegianOkinawanOsageOttawaPaiutePakistaniPalestinianPanamanianPennsylvania GermanPeruvianPimaPolishPortuguesePotawatomiPuebloPuerto RicanPuget Sound SalishRomanianRussianSalvadoranSamoanScandinavianScotch-IrishScottishSeminoleSenegaleseSerbianShoshoneSierra LeoneanSiouxSlavicSlovakSloveneSomaliSouth AfricanSouth AmericanSouth American IndianSoviet UnionSpaniardSpanishSpanish AmericanSpanish American IndianSri LankanSubsaharan AfricanSudaneseSwedishSwissSyrianTaiwaneseThaiTlingit-HaidaTohono O'OdhamTonganTrinidadian and TobagonianTsimshianTurkishU.S. Virgin IslanderUgandanUkrainianUruguayanUteVenezuelanVietnameseWelshWest IndianYakamaYaquiYugoslavianYumanYup'ikZimbabwean
Immigration
NonimmigrantsImmigrantsAfghanistanAfricaAlbaniaArgentinaArmeniaAsiaAustraliaAustriaBahamasBangladeshBarbadosBelarusBelgiumBelizeBoliviaBosnia and HerzegovinaBrazilBulgariaBurma/MyanmarCabo VerdeCambodiaCameroonCanadaCaribbeanCentral AmericaChileChinaColombiaCongoCosta RicaCroatiaCubaCzechoslovakiaDenmarkDominicaDominican RepublicEastern AfricaEastern AsiaEastern EuropeEcuadorEgyptEl SalvadorEnglandEritreaEthiopiaEuropeFijiFranceGermanyGhanaGreeceGrenadaGuatemalaGuyanaHaitiHondurasHong KongHungaryIndiaIndonesiaIranIraqIrelandIsraelItalyJamaicaJapanJordanKazakhstanKenyaKoreaKuwaitLaosLatin AmericaLatviaLebanonLiberiaLithuaniaMalaysiaMexicoMicronesiaMiddle AfricaMoldovaMoroccoNepalNetherlandsNicaraguaNigeriaNorth AmericaNorth MacedoniaNorthern AfricaNorthern EuropeNorwayOceaniaPakistanPanamaPeruPhilippinesPolandPortugalRomaniaRussiaSaudi ArabiaScotlandSenegalSerbiaSierra LeoneSingaporeSomaliaSouth AfricaSouth AmericaSouth Central AsiaSouth Eastern AsiaSouthern EuropeSpainSri LankaSt. Vincent and the GrenadinesSudanSwedenSwitzerlandSyriaTaiwanThailandTrinidad and TobagoTurkeyUgandaUkraineUruguayUzbekistanVenezuelaVietnamWest IndiesWestern AfricaWestern AsiaWestern EuropeYemenZaireZimbabweAzores
Paraguayan
Race
Ancestry
AfghanAfricanAlaska NativeAlaskan AthabascanAlbanianAleutAlsatianAmericanApacheArabArapahoArgentineanArmenianAssyrian/Chaldean/SyriacAustralianAustrianBahamianBangladeshiBarbadianBasqueBelgianBelizeanBermudanBhutaneseBlackfeetBolivianBrazilianBritishBritish West IndianBulgarianBurmeseCajunCambodianCanadianCape VerdeanCarpatho RusynCelticCentral AmericanCentral American IndianCherokeeCheyenneChickasawChileanChineseChippewaChoctawColombianColvilleComancheCosta RicanCreeCreekCroatianCrowCubanCypriotCzechCzechoslovakianDanishDelawareDominicanDutchDutch West IndianEastern EuropeanEcuadorianEgyptianEnglishEstonianEthiopianEuropeanFijianFilipinoFinnishFrenchFrench American IndianFrench CanadianGermanGerman RussianGhanaianGreekGuamanian/ChamorroGuatemalanGuyaneseHaitianHmongHonduranHopiHoumaHungarianIcelanderIndian (Asian)IndonesianInupiatIranianIraqiIrishIroquoisIsraeliItalianJamaicanJapaneseJordanianKenyanKiowaKoreanLaotianLatvianLebaneseLiberianLithuanianLumbeeLuxembourgerMacedonianMalaysianMalteseMarshalleseMenomineeMexicanMexican American IndianMongolianMoroccanNative HawaiianNavajoNepaleseNew ZealanderNicaraguanNigerianNorthern EuropeanNorwegianOkinawanOsageOttawaPaiutePakistaniPalestinianPanamanianParaguayanPennsylvania GermanPeruvianPimaPolishPortuguesePotawatomiPuebloPuerto RicanPuget Sound SalishRomanianRussianSalvadoranSamoanScandinavianScotch-IrishScottishSeminoleSenegaleseSerbianShoshoneSierra LeoneanSiouxSlavicSlovakSloveneSomaliSouth AfricanSouth AmericanSouth American IndianSoviet UnionSpaniardSpanishSpanish AmericanSpanish American IndianSri LankanSubsaharan AfricanSudaneseSwedishSwissSyrianTaiwaneseThaiTlingit-HaidaTohono O'OdhamTonganTrinidadian and TobagonianTsimshianTurkishU.S. Virgin IslanderUgandanUkrainianUruguayanUteVenezuelanVietnameseWelshWest IndianYakamaYaquiYugoslavianYumanYup'ikZimbabwean
Immigration
NonimmigrantsImmigrantsAfghanistanAfricaAlbaniaArgentinaArmeniaAsiaAustraliaAustriaBahamasBangladeshBarbadosBelarusBelgiumBelizeBoliviaBosnia and HerzegovinaBrazilBulgariaBurma/MyanmarCabo VerdeCambodiaCameroonCanadaCaribbeanCentral AmericaChileChinaColombiaCongoCosta RicaCroatiaCubaCzechoslovakiaDenmarkDominicaDominican RepublicEastern AfricaEastern AsiaEastern EuropeEcuadorEgyptEl SalvadorEnglandEritreaEthiopiaEuropeFijiFranceGermanyGhanaGreeceGrenadaGuatemalaGuyanaHaitiHondurasHong KongHungaryIndiaIndonesiaIranIraqIrelandIsraelItalyJamaicaJapanJordanKazakhstanKenyaKoreaKuwaitLaosLatin AmericaLatviaLebanonLiberiaLithuaniaMalaysiaMexicoMicronesiaMiddle AfricaMoldovaMoroccoNepalNetherlandsNicaraguaNigeriaNorth AmericaNorth MacedoniaNorthern AfricaNorthern EuropeNorwayOceaniaPakistanPanamaPeruPhilippinesPolandPortugalRomaniaRussiaSaudi ArabiaScotlandSenegalSerbiaSierra LeoneSingaporeSomaliaSouth AfricaSouth AmericaSouth Central AsiaSouth Eastern AsiaSouthern EuropeSpainSri LankaSt. Vincent and the GrenadinesSudanSwedenSwitzerlandSyriaTaiwanThailandTrinidad and TobagoTurkeyUgandaUkraineUruguayUzbekistanVenezuelaVietnamWest IndiesWestern AfricaWestern AsiaWestern EuropeYemenZaireZimbabweAzores
Average Family Size
Income
Poverty
Unemployment
Labor Participation
Family Structure
Vehicle Availability
Education Level
Disability

Average Family Size Comparison

Hispanics or Latinos

Paraguayans

Exceptional
Poor
3.41
AVERAGE FAMILY SIZE
100.0/ 100
METRIC RATING
34th/ 347
METRIC RANK
3.20
AVERAGE FAMILY SIZE
16.3/ 100
METRIC RATING
205th/ 347
METRIC RANK

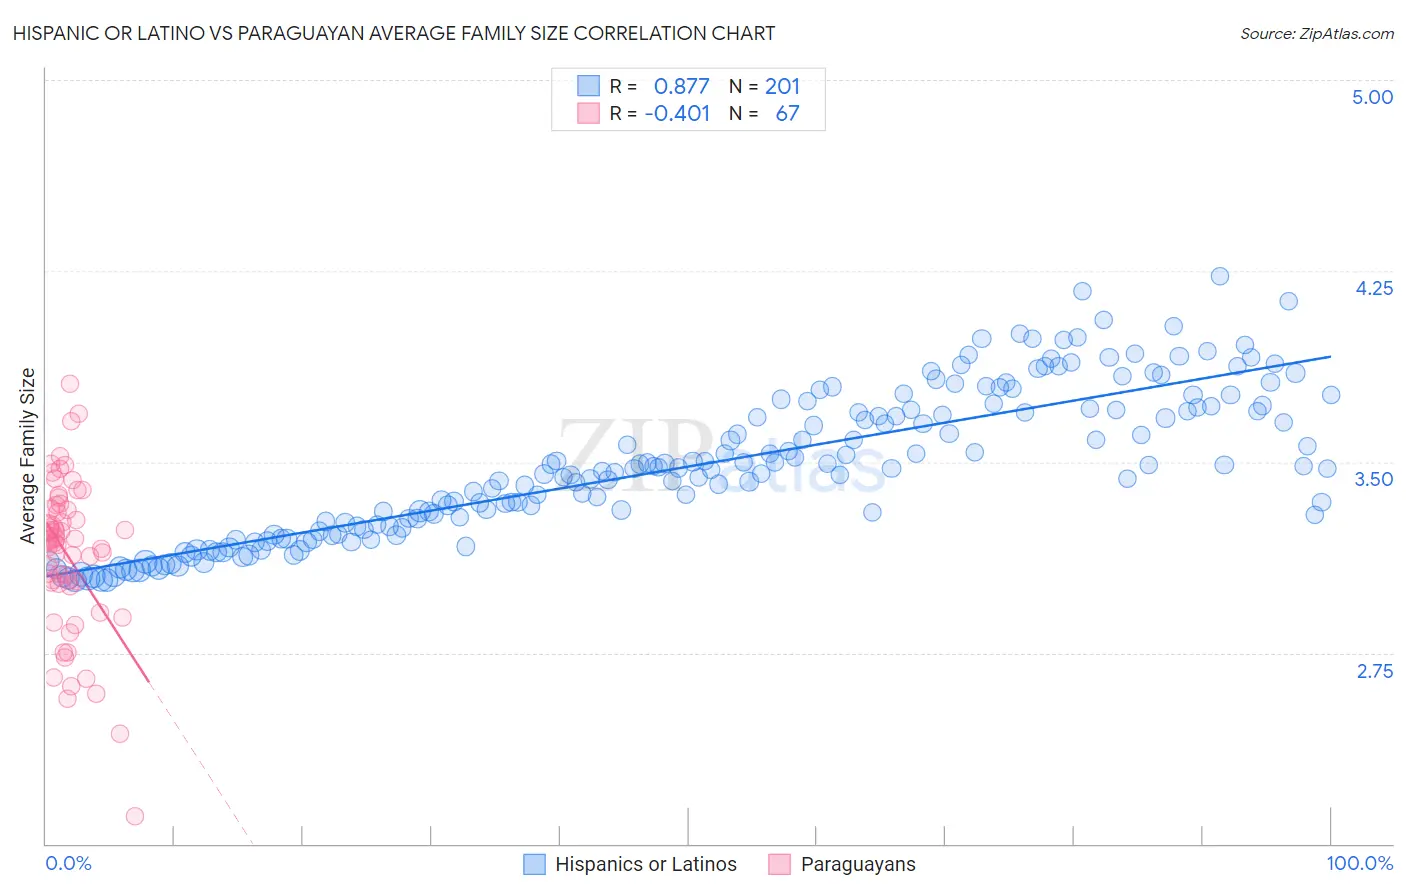
Hispanic or Latino vs Paraguayan Average Family Size Correlation Chart

The statistical analysis conducted on geographies consisting of 577,913,054 people shows a very strong positive correlation between the proportion of Hispanics or Latinos and average family size in the United States with a correlation coefficient (R) of 0.877 and weighted average of 3.41. Similarly, the statistical analysis conducted on geographies consisting of 95,095,397 people shows a moderate negative correlation between the proportion of Paraguayans and average family size in the United States with a correlation coefficient (R) of -0.401 and weighted average of 3.20, a difference of 6.3%.
Hispanic or Latino vs Paraguayan Average Family Size

Average Family Size Correlation Summary

MeasurementHispanic or LatinoParaguayan
Minimum3.032.11
Maximum4.233.80
Range1.201.69
Mean3.483.13
Median3.473.19
Interquartile 25% (IQ1)3.243.02
Interquartile 75% (IQ3)3.713.32
Interquartile Range (IQR)0.470.29
Standard Deviation (Sample)0.290.31
Standard Deviation (Population)0.290.30

Similar Demographics by Average Family Size

Demographics Similar to Hispanics or Latinos by Average Family Size

In terms of average family size, the demographic groups most similar to Hispanics or Latinos are Hawaiian (3.41, a difference of 0.050%), Guatemalan (3.40, a difference of 0.060%), Immigrants from Guatemala (3.41, a difference of 0.080%), Immigrants from Guyana (3.40, a difference of 0.11%), and Central American (3.41, a difference of 0.18%).
DemographicsRating | RankAverage Family Size
Mexican American Indians
100.0
/100
|
#27
Exceptional
3.43
Immigrants | Latin America
100.0
/100
|
#28
Exceptional
3.42
Nepalese
100.0
/100
|
#29
Exceptional
3.42
Samoans
100.0
/100
|
#30
Exceptional
3.42
Central Americans
100.0
/100
|
#31
Exceptional
3.41
Immigrants | Guatemala
100.0
/100
|
#32
Exceptional
3.41
Hawaiians
100.0
/100
|
#33
Exceptional
3.41
Hispanics or Latinos
100.0
/100
|
#34
Exceptional
3.41
Guatemalans
100.0
/100
|
#35
Exceptional
3.40
Immigrants | Guyana
100.0
/100
|
#36
Exceptional
3.40
Guyanese
100.0
/100
|
#37
Exceptional
3.40
Immigrants | Belize
100.0
/100
|
#38
Exceptional
3.39
Immigrants | Haiti
100.0
/100
|
#39
Exceptional
3.39
Belizeans
100.0
/100
|
#40
Exceptional
3.39
Marshallese
100.0
/100
|
#41
Exceptional
3.38

Demographics Similar to Paraguayans by Average Family Size

In terms of average family size, the demographic groups most similar to Paraguayans are Immigrants from Poland (3.20, a difference of 0.010%), Immigrants from Cabo Verde (3.20, a difference of 0.010%), Immigrants from Nepal (3.21, a difference of 0.060%), Immigrants from Morocco (3.21, a difference of 0.070%), and Immigrants from India (3.21, a difference of 0.070%).
DemographicsRating | RankAverage Family Size
Immigrants | Azores
21.7
/100
|
#198
Fair
3.21
Hmong
20.7
/100
|
#199
Fair
3.21
Immigrants | Kenya
19.2
/100
|
#200
Poor
3.21
Immigrants | Morocco
18.5
/100
|
#201
Poor
3.21
Immigrants | India
18.5
/100
|
#202
Poor
3.21
Immigrants | Nepal
18.1
/100
|
#203
Poor
3.21
Immigrants | Poland
16.6
/100
|
#204
Poor
3.20
Paraguayans
16.3
/100
|
#205
Poor
3.20
Immigrants | Cabo Verde
16.0
/100
|
#206
Poor
3.20
Filipinos
13.6
/100
|
#207
Poor
3.20
Chippewa
13.3
/100
|
#208
Poor
3.20
Sudanese
13.3
/100
|
#209
Poor
3.20
Zimbabweans
12.6
/100
|
#210
Poor
3.20
Immigrants | Iran
12.1
/100
|
#211
Poor
3.20
Creek
12.1
/100
|
#212
Poor
3.20