Hawaiian vs Immigrants from Western Africa Family Households

COMPARE

Hawaiian
Race
Ancestry
AfghanAfricanAlaska NativeAlaskan AthabascanAlbanianAleutAlsatianAmericanApacheArabArapahoArgentineanArmenianAssyrian/Chaldean/SyriacAustralianAustrianBahamianBangladeshiBarbadianBasqueBelgianBelizeanBermudanBhutaneseBlackfeetBolivianBrazilianBritishBritish West IndianBulgarianBurmeseCajunCambodianCanadianCape VerdeanCarpatho RusynCelticCentral AmericanCentral American IndianCherokeeCheyenneChickasawChileanChineseChippewaChoctawColombianColvilleComancheCosta RicanCreeCreekCroatianCrowCubanCypriotCzechCzechoslovakianDanishDelawareDominicanDutchDutch West IndianEastern EuropeanEcuadorianEgyptianEnglishEstonianEthiopianEuropeanFijianFilipinoFinnishFrenchFrench American IndianFrench CanadianGermanGerman RussianGhanaianGreekGuamanian/ChamorroGuatemalanGuyaneseHaitianHmongHonduranHopiHoumaHungarianIcelanderIndian (Asian)IndonesianInupiatIranianIraqiIrishIroquoisIsraeliItalianJamaicanJapaneseJordanianKenyanKiowaKoreanLaotianLatvianLebaneseLiberianLithuanianLumbeeLuxembourgerMacedonianMalaysianMalteseMarshalleseMenomineeMexicanMexican American IndianMongolianMoroccanNative HawaiianNavajoNepaleseNew ZealanderNicaraguanNigerianNorthern EuropeanNorwegianOkinawanOsageOttawaPaiutePakistaniPalestinianPanamanianParaguayanPennsylvania GermanPeruvianPimaPolishPortuguesePotawatomiPuebloPuerto RicanPuget Sound SalishRomanianRussianSalvadoranSamoanScandinavianScotch-IrishScottishSeminoleSenegaleseSerbianShoshoneSierra LeoneanSiouxSlavicSlovakSloveneSomaliSouth AfricanSouth AmericanSouth American IndianSoviet UnionSpaniardSpanishSpanish AmericanSpanish American IndianSri LankanSubsaharan AfricanSudaneseSwedishSwissSyrianTaiwaneseThaiTlingit-HaidaTohono O'OdhamTonganTrinidadian and TobagonianTsimshianTurkishU.S. Virgin IslanderUgandanUkrainianUruguayanUteVenezuelanVietnameseWelshWest IndianYakamaYaquiYugoslavianYumanYup'ikZimbabwean
Immigration
NonimmigrantsImmigrantsAfghanistanAfricaAlbaniaArgentinaArmeniaAsiaAustraliaAustriaBahamasBangladeshBarbadosBelarusBelgiumBelizeBoliviaBosnia and HerzegovinaBrazilBulgariaBurma/MyanmarCabo VerdeCambodiaCameroonCanadaCaribbeanCentral AmericaChileChinaColombiaCongoCosta RicaCroatiaCubaCzechoslovakiaDenmarkDominicaDominican RepublicEastern AfricaEastern AsiaEastern EuropeEcuadorEgyptEl SalvadorEnglandEritreaEthiopiaEuropeFijiFranceGermanyGhanaGreeceGrenadaGuatemalaGuyanaHaitiHondurasHong KongHungaryIndiaIndonesiaIranIraqIrelandIsraelItalyJamaicaJapanJordanKazakhstanKenyaKoreaKuwaitLaosLatin AmericaLatviaLebanonLiberiaLithuaniaMalaysiaMexicoMicronesiaMiddle AfricaMoldovaMoroccoNepalNetherlandsNicaraguaNigeriaNorth AmericaNorth MacedoniaNorthern AfricaNorthern EuropeNorwayOceaniaPakistanPanamaPeruPhilippinesPolandPortugalRomaniaRussiaSaudi ArabiaScotlandSenegalSerbiaSierra LeoneSingaporeSomaliaSouth AfricaSouth AmericaSouth Central AsiaSouth Eastern AsiaSouthern EuropeSpainSri LankaSt. Vincent and the GrenadinesSudanSwedenSwitzerlandSyriaTaiwanThailandTrinidad and TobagoTurkeyUgandaUkraineUruguayUzbekistanVenezuelaVietnamWest IndiesWestern AsiaWestern EuropeYemenZaireZimbabweAzores
Immigrants from Western Africa
Race
Ancestry
AfghanAfricanAlaska NativeAlaskan AthabascanAlbanianAleutAlsatianAmericanApacheArabArapahoArgentineanArmenianAssyrian/Chaldean/SyriacAustralianAustrianBahamianBangladeshiBarbadianBasqueBelgianBelizeanBermudanBhutaneseBlackfeetBolivianBrazilianBritishBritish West IndianBulgarianBurmeseCajunCambodianCanadianCape VerdeanCarpatho RusynCelticCentral AmericanCentral American IndianCherokeeCheyenneChickasawChileanChineseChippewaChoctawColombianColvilleComancheCosta RicanCreeCreekCroatianCrowCubanCypriotCzechCzechoslovakianDanishDelawareDominicanDutchDutch West IndianEastern EuropeanEcuadorianEgyptianEnglishEstonianEthiopianEuropeanFijianFilipinoFinnishFrenchFrench American IndianFrench CanadianGermanGerman RussianGhanaianGreekGuamanian/ChamorroGuatemalanGuyaneseHaitianHmongHonduranHopiHoumaHungarianIcelanderIndian (Asian)IndonesianInupiatIranianIraqiIrishIroquoisIsraeliItalianJamaicanJapaneseJordanianKenyanKiowaKoreanLaotianLatvianLebaneseLiberianLithuanianLumbeeLuxembourgerMacedonianMalaysianMalteseMarshalleseMenomineeMexicanMexican American IndianMongolianMoroccanNative HawaiianNavajoNepaleseNew ZealanderNicaraguanNigerianNorthern EuropeanNorwegianOkinawanOsageOttawaPaiutePakistaniPalestinianPanamanianParaguayanPennsylvania GermanPeruvianPimaPolishPortuguesePotawatomiPuebloPuerto RicanPuget Sound SalishRomanianRussianSalvadoranSamoanScandinavianScotch-IrishScottishSeminoleSenegaleseSerbianShoshoneSierra LeoneanSiouxSlavicSlovakSloveneSomaliSouth AfricanSouth AmericanSouth American IndianSoviet UnionSpaniardSpanishSpanish AmericanSpanish American IndianSri LankanSubsaharan AfricanSudaneseSwedishSwissSyrianTaiwaneseThaiTlingit-HaidaTohono O'OdhamTonganTrinidadian and TobagonianTsimshianTurkishU.S. Virgin IslanderUgandanUkrainianUruguayanUteVenezuelanVietnameseWelshWest IndianYakamaYaquiYugoslavianYumanYup'ikZimbabwean
Immigration
NonimmigrantsImmigrantsAfghanistanAfricaAlbaniaArgentinaArmeniaAsiaAustraliaAustriaBahamasBangladeshBarbadosBelarusBelgiumBelizeBoliviaBosnia and HerzegovinaBrazilBulgariaBurma/MyanmarCabo VerdeCambodiaCameroonCanadaCaribbeanCentral AmericaChileChinaColombiaCongoCosta RicaCroatiaCubaCzechoslovakiaDenmarkDominicaDominican RepublicEastern AfricaEastern AsiaEastern EuropeEcuadorEgyptEl SalvadorEnglandEritreaEthiopiaEuropeFijiFranceGermanyGhanaGreeceGrenadaGuatemalaGuyanaHaitiHondurasHong KongHungaryIndiaIndonesiaIranIraqIrelandIsraelItalyJamaicaJapanJordanKazakhstanKenyaKoreaKuwaitLaosLatin AmericaLatviaLebanonLiberiaLithuaniaMalaysiaMexicoMicronesiaMiddle AfricaMoldovaMoroccoNepalNetherlandsNicaraguaNigeriaNorth AmericaNorth MacedoniaNorthern AfricaNorthern EuropeNorwayOceaniaPakistanPanamaPeruPhilippinesPolandPortugalRomaniaRussiaSaudi ArabiaScotlandSenegalSerbiaSierra LeoneSingaporeSomaliaSouth AfricaSouth AmericaSouth Central AsiaSouth Eastern AsiaSouthern EuropeSpainSri LankaSt. Vincent and the GrenadinesSudanSwedenSwitzerlandSyriaTaiwanThailandTrinidad and TobagoTurkeyUgandaUkraineUruguayUzbekistanVenezuelaVietnamWest IndiesWestern AfricaWestern AsiaWestern EuropeYemenZaireZimbabweAzores
Family Households
Income
Poverty
Unemployment
Labor Participation
Family Structure
Vehicle Availability
Education Level
Disability

Family Households Comparison

Hawaiians

Immigrants from Western Africa

Exceptional
Tragic
67.4%
FAMILY HOUSEHOLDS
100.0/ 100
METRIC RATING
28th/ 347
METRIC RANK
63.1%
FAMILY HOUSEHOLDS
0.5/ 100
METRIC RATING
266th/ 347
METRIC RANK

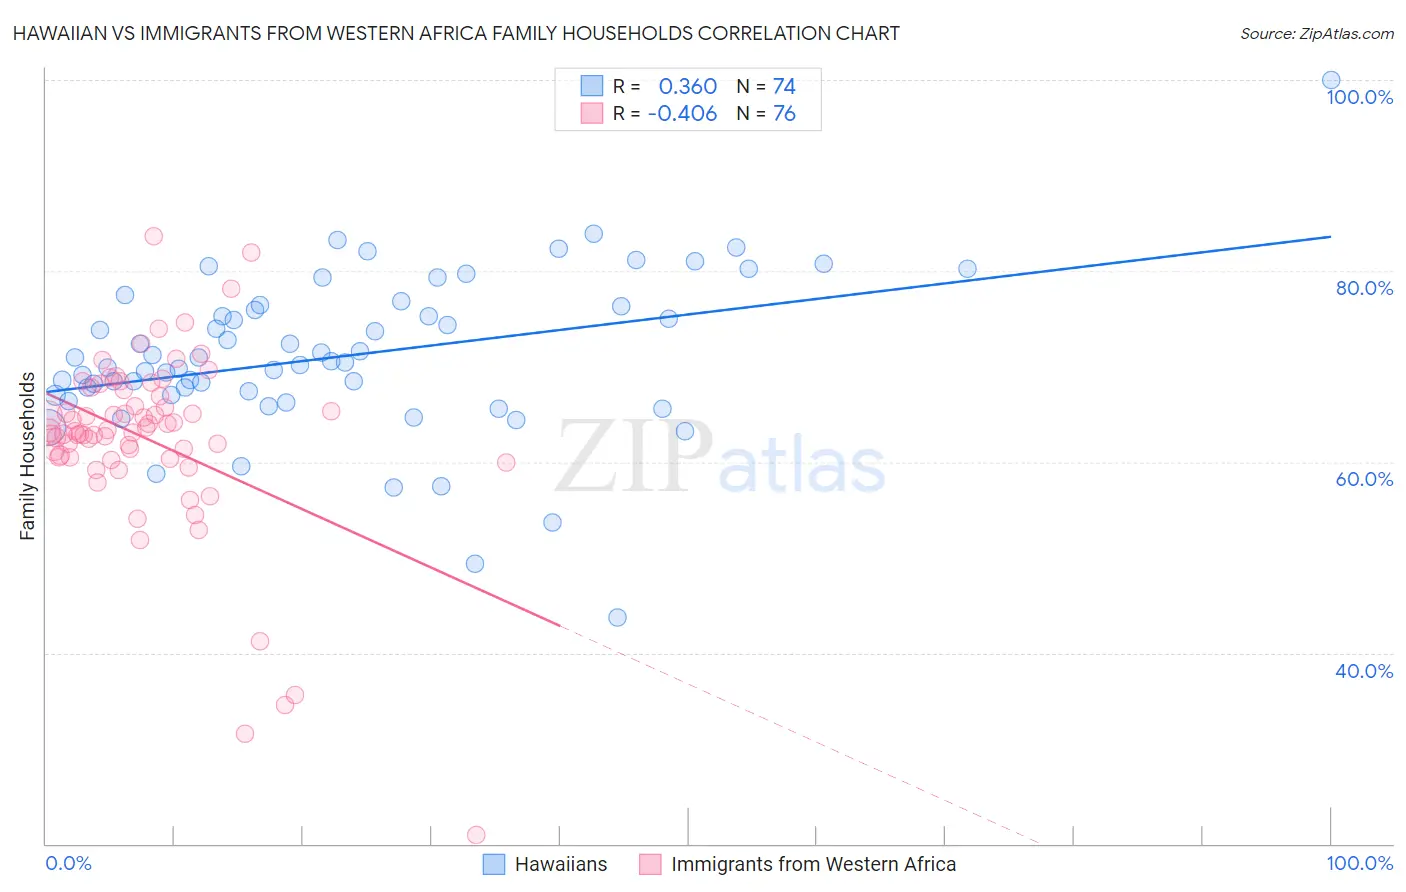
Hawaiian vs Immigrants from Western Africa Family Households Correlation Chart

The statistical analysis conducted on geographies consisting of 327,392,617 people shows a mild positive correlation between the proportion of Hawaiians and percentage of family households in the United States with a correlation coefficient (R) of 0.360 and weighted average of 67.4%. Similarly, the statistical analysis conducted on geographies consisting of 357,554,747 people shows a moderate negative correlation between the proportion of Immigrants from Western Africa and percentage of family households in the United States with a correlation coefficient (R) of -0.406 and weighted average of 63.1%, a difference of 6.8%.
Hawaiian vs Immigrants from Western Africa Family Households

Family Households Correlation Summary

MeasurementHawaiianImmigrants from Western Africa
Minimum43.7%20.9%
Maximum100.0%83.6%
Range56.3%62.7%
Mean71.1%62.4%
Median70.5%63.3%
Interquartile 25% (IQ1)67.0%60.5%
Interquartile 75% (IQ3)76.4%67.2%
Interquartile Range (IQR)9.3%6.7%
Standard Deviation (Sample)8.5%9.9%
Standard Deviation (Population)8.4%9.8%

Similar Demographics by Family Households

Demographics Similar to Hawaiians by Family Households

In terms of family households, the demographic groups most similar to Hawaiians are Hispanic or Latino (67.4%, a difference of 0.010%), Immigrants from India (67.4%, a difference of 0.060%), Immigrants from Nicaragua (67.5%, a difference of 0.070%), Nicaraguan (67.4%, a difference of 0.070%), and Immigrants from South Eastern Asia (67.5%, a difference of 0.090%).
DemographicsRating | RankFamily Households
Cubans
100.0
/100
|
#21
Exceptional
67.7%
Sri Lankans
100.0
/100
|
#22
Exceptional
67.7%
Immigrants | Pakistan
100.0
/100
|
#23
Exceptional
67.7%
Immigrants | South Eastern Asia
100.0
/100
|
#24
Exceptional
67.5%
Immigrants | Nicaragua
100.0
/100
|
#25
Exceptional
67.5%
Immigrants | India
100.0
/100
|
#26
Exceptional
67.4%
Hispanics or Latinos
100.0
/100
|
#27
Exceptional
67.4%
Hawaiians
100.0
/100
|
#28
Exceptional
67.4%
Nicaraguans
100.0
/100
|
#29
Exceptional
67.4%
Immigrants | Peru
100.0
/100
|
#30
Exceptional
67.2%
Immigrants | Latin America
100.0
/100
|
#31
Exceptional
67.2%
Nepalese
100.0
/100
|
#32
Exceptional
67.2%
Salvadorans
100.0
/100
|
#33
Exceptional
67.2%
Thais
100.0
/100
|
#34
Exceptional
67.2%
Tohono O'odham
100.0
/100
|
#35
Exceptional
67.1%

Demographics Similar to Immigrants from Western Africa by Family Households

In terms of family households, the demographic groups most similar to Immigrants from Western Africa are Colville (63.2%, a difference of 0.010%), Cheyenne (63.2%, a difference of 0.020%), Kenyan (63.2%, a difference of 0.020%), Israeli (63.1%, a difference of 0.040%), and Immigrants from Ireland (63.2%, a difference of 0.050%).
DemographicsRating | RankFamily Households
Immigrants | Western Europe
0.6
/100
|
#259
Tragic
63.2%
Cypriots
0.6
/100
|
#260
Tragic
63.2%
Immigrants | Russia
0.6
/100
|
#261
Tragic
63.2%
Immigrants | Ireland
0.6
/100
|
#262
Tragic
63.2%
Cheyenne
0.5
/100
|
#263
Tragic
63.2%
Kenyans
0.5
/100
|
#264
Tragic
63.2%
Colville
0.5
/100
|
#265
Tragic
63.2%
Immigrants | Western Africa
0.5
/100
|
#266
Tragic
63.1%
Israelis
0.4
/100
|
#267
Tragic
63.1%
Immigrants | Singapore
0.4
/100
|
#268
Tragic
63.1%
Yugoslavians
0.4
/100
|
#269
Tragic
63.1%
Immigrants | Austria
0.3
/100
|
#270
Tragic
63.1%
Immigrants | Croatia
0.3
/100
|
#271
Tragic
63.1%
Immigrants | Turkey
0.3
/100
|
#272
Tragic
63.1%
Immigrants | Kazakhstan
0.3
/100
|
#273
Tragic
63.1%