Hawaiian vs Immigrants from Laos Births to Unmarried Women
COMPARE
Hawaiian
Immigrants from Laos
Births to Unmarried Women
Births to Unmarried Women Comparison
Hawaiians
Immigrants from Laos
33.2%
BIRTHS TO UNMARRIED WOMEN
11.3/ 100
METRIC RATING
208th/ 347
METRIC RANK
34.0%
BIRTHS TO UNMARRIED WOMEN
4.3/ 100
METRIC RATING
224th/ 347
METRIC RANK
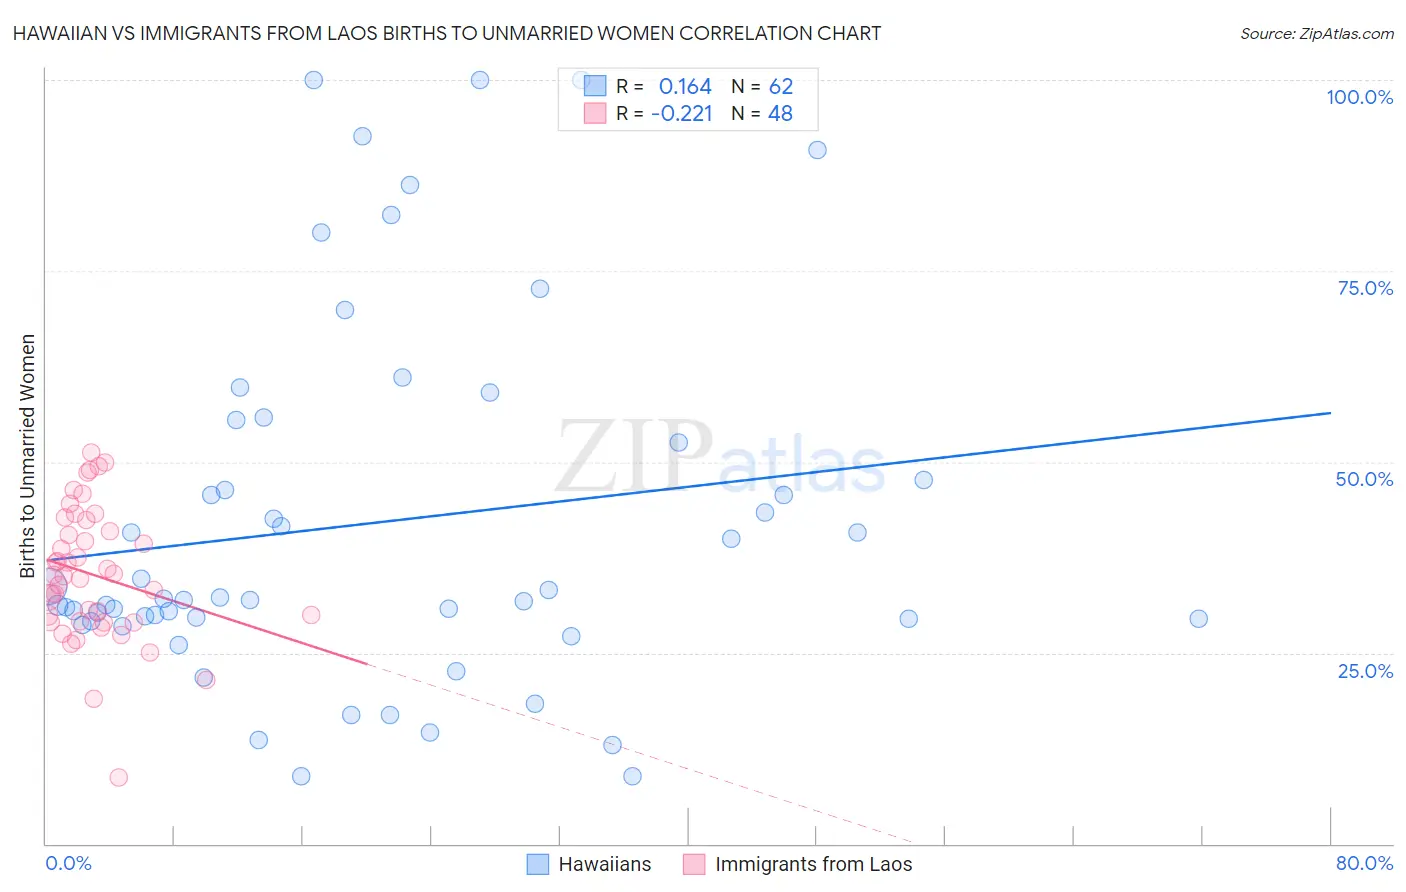
Hawaiian vs Immigrants from Laos Births to Unmarried Women Correlation Chart
The statistical analysis conducted on geographies consisting of 312,224,673 people shows a poor positive correlation between the proportion of Hawaiians and percentage of births to unmarried women in the United States with a correlation coefficient (R) of 0.164 and weighted average of 33.2%. Similarly, the statistical analysis conducted on geographies consisting of 196,196,107 people shows a weak negative correlation between the proportion of Immigrants from Laos and percentage of births to unmarried women in the United States with a correlation coefficient (R) of -0.221 and weighted average of 34.0%, a difference of 2.4%.
Births to Unmarried Women Correlation Summary
| Measurement | Hawaiian | Immigrants from Laos |
| Minimum | 8.9% | 8.7% |
| Maximum | 100.0% | 51.2% |
| Range | 91.1% | 42.5% |
| Mean | 42.0% | 35.2% |
| Median | 31.9% | 35.1% |
| Interquartile 25% (IQ1) | 29.4% | 29.1% |
| Interquartile 75% (IQ3) | 52.6% | 41.7% |
| Interquartile Range (IQR) | 23.2% | 12.6% |
| Standard Deviation (Sample) | 23.6% | 8.7% |
| Standard Deviation (Population) | 23.4% | 8.6% |
Demographics Similar to Hawaiians and Immigrants from Laos by Births to Unmarried Women
In terms of births to unmarried women, the demographic groups most similar to Hawaiians are Immigrants from Sudan (33.2%, a difference of 0.030%), White/Caucasian (33.3%, a difference of 0.14%), Scotch-Irish (33.3%, a difference of 0.14%), Ecuadorian (33.3%, a difference of 0.19%), and Celtic (33.3%, a difference of 0.25%). Similarly, the demographic groups most similar to Immigrants from Laos are Pennsylvania German (34.0%, a difference of 0.0%), Spanish (34.1%, a difference of 0.16%), Immigrants from Uruguay (33.9%, a difference of 0.29%), Malaysian (33.9%, a difference of 0.36%), and Portuguese (33.8%, a difference of 0.53%).
| Demographics | Rating | Rank | Births to Unmarried Women |
| Uruguayans | 12.8 /100 | #206 | Poor 33.1% |
| Immigrants | Sudan | 11.5 /100 | #207 | Poor 33.2% |
| Hawaiians | 11.3 /100 | #208 | Poor 33.2% |
| Whites/Caucasians | 10.7 /100 | #209 | Poor 33.3% |
| Scotch-Irish | 10.7 /100 | #210 | Poor 33.3% |
| Ecuadorians | 10.5 /100 | #211 | Poor 33.3% |
| Celtics | 10.2 /100 | #212 | Poor 33.3% |
| Immigrants | Costa Rica | 9.5 /100 | #213 | Tragic 33.4% |
| Slovaks | 9.3 /100 | #214 | Tragic 33.4% |
| French | 8.7 /100 | #215 | Tragic 33.4% |
| Nepalese | 7.8 /100 | #216 | Tragic 33.5% |
| Spaniards | 7.0 /100 | #217 | Tragic 33.6% |
| Immigrants | Ecuador | 5.9 /100 | #218 | Tragic 33.7% |
| Alsatians | 5.4 /100 | #219 | Tragic 33.8% |
| Portuguese | 5.4 /100 | #220 | Tragic 33.8% |
| Malaysians | 5.0 /100 | #221 | Tragic 33.9% |
| Immigrants | Uruguay | 4.8 /100 | #222 | Tragic 33.9% |
| Pennsylvania Germans | 4.3 /100 | #223 | Tragic 34.0% |
| Immigrants | Laos | 4.3 /100 | #224 | Tragic 34.0% |
| Spanish | 4.0 /100 | #225 | Tragic 34.1% |
| Delaware | 3.3 /100 | #226 | Tragic 34.2% |