Hawaiian vs Immigrants from Eastern Europe Single Mother Households
COMPARE
Hawaiian
Immigrants from Eastern Europe
Single Mother Households
Single Mother Households Comparison
Hawaiians
Immigrants from Eastern Europe
6.6%
SINGLE MOTHER HOUSEHOLDS
16.1/ 100
METRIC RATING
198th/ 347
METRIC RANK
5.6%
SINGLE MOTHER HOUSEHOLDS
98.4/ 100
METRIC RATING
70th/ 347
METRIC RANK
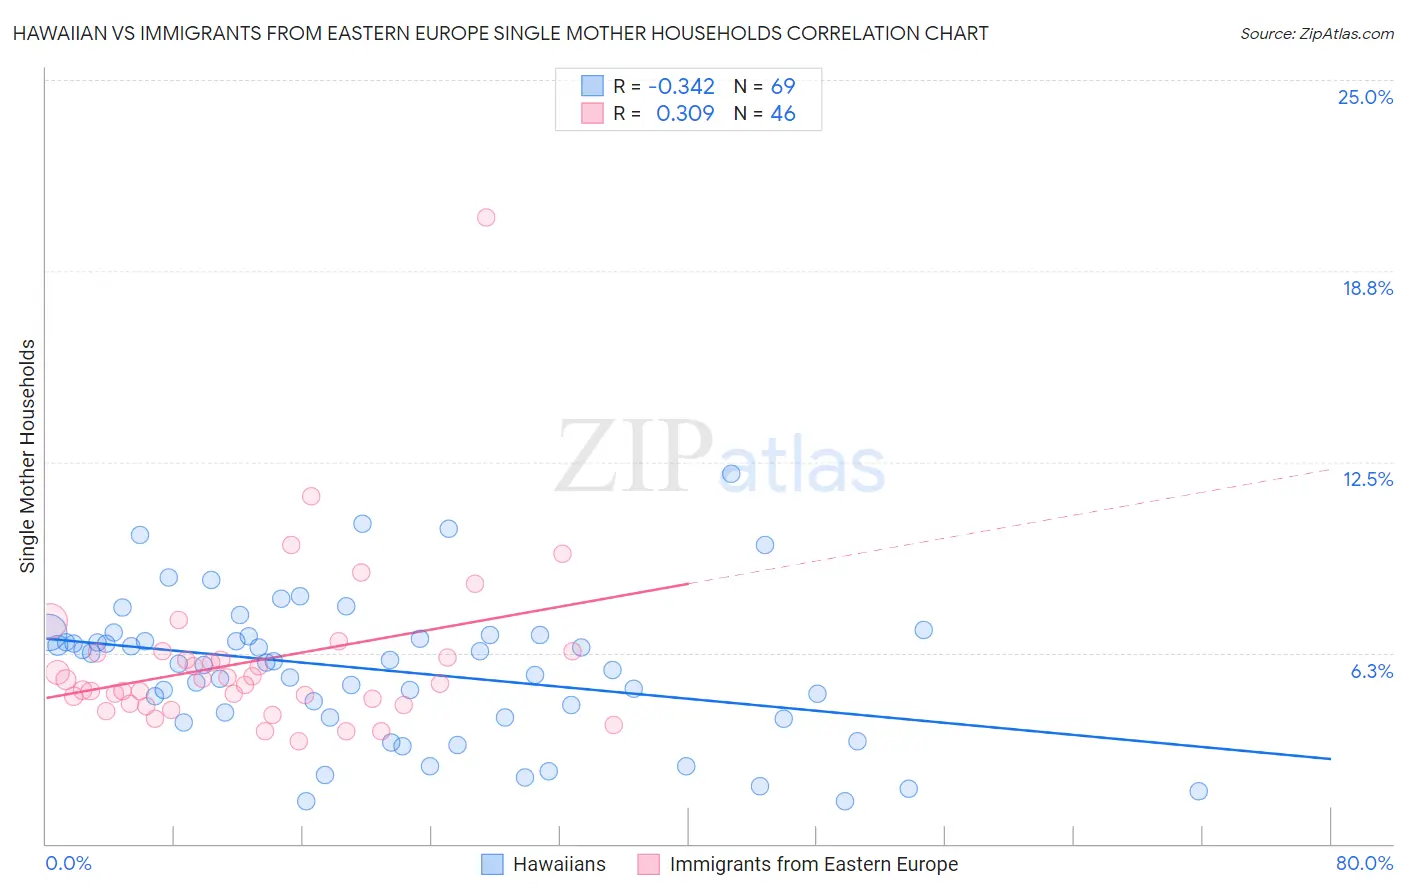
Hawaiian vs Immigrants from Eastern Europe Single Mother Households Correlation Chart
The statistical analysis conducted on geographies consisting of 326,738,155 people shows a mild negative correlation between the proportion of Hawaiians and percentage of single mother households in the United States with a correlation coefficient (R) of -0.342 and weighted average of 6.6%. Similarly, the statistical analysis conducted on geographies consisting of 473,555,541 people shows a mild positive correlation between the proportion of Immigrants from Eastern Europe and percentage of single mother households in the United States with a correlation coefficient (R) of 0.309 and weighted average of 5.6%, a difference of 17.9%.
Single Mother Households Correlation Summary
| Measurement | Hawaiian | Immigrants from Eastern Europe |
| Minimum | 1.4% | 3.3% |
| Maximum | 12.1% | 20.5% |
| Range | 10.7% | 17.1% |
| Mean | 5.7% | 6.0% |
| Median | 5.9% | 5.3% |
| Interquartile 25% (IQ1) | 4.1% | 4.6% |
| Interquartile 75% (IQ3) | 6.8% | 6.3% |
| Interquartile Range (IQR) | 2.7% | 1.7% |
| Standard Deviation (Sample) | 2.3% | 2.8% |
| Standard Deviation (Population) | 2.3% | 2.7% |
Similar Demographics by Single Mother Households
Demographics Similar to Hawaiians by Single Mother Households
In terms of single mother households, the demographic groups most similar to Hawaiians are Potawatomi (6.6%, a difference of 0.11%), Moroccan (6.6%, a difference of 0.25%), Immigrants from Ethiopia (6.6%, a difference of 0.27%), South American (6.6%, a difference of 0.36%), and Uruguayan (6.6%, a difference of 0.36%).
| Demographics | Rating | Rank | Single Mother Households |
| Samoans | 21.2 /100 | #191 | Fair 6.5% |
| Americans | 19.0 /100 | #192 | Poor 6.6% |
| Colombians | 18.3 /100 | #193 | Poor 6.6% |
| Immigrants | Uganda | 18.3 /100 | #194 | Poor 6.6% |
| South Americans | 18.0 /100 | #195 | Poor 6.6% |
| Uruguayans | 18.0 /100 | #196 | Poor 6.6% |
| Moroccans | 17.4 /100 | #197 | Poor 6.6% |
| Hawaiians | 16.1 /100 | #198 | Poor 6.6% |
| Potawatomi | 15.5 /100 | #199 | Poor 6.6% |
| Immigrants | Ethiopia | 14.7 /100 | #200 | Poor 6.6% |
| Venezuelans | 12.9 /100 | #201 | Poor 6.6% |
| Guamanians/Chamorros | 12.4 /100 | #202 | Poor 6.6% |
| Immigrants | Peru | 12.0 /100 | #203 | Poor 6.7% |
| Immigrants | Fiji | 11.9 /100 | #204 | Poor 6.7% |
| Cree | 11.9 /100 | #205 | Poor 6.7% |
Demographics Similar to Immigrants from Eastern Europe by Single Mother Households
In terms of single mother households, the demographic groups most similar to Immigrants from Eastern Europe are Immigrants from Kazakhstan (5.6%, a difference of 0.010%), Asian (5.6%, a difference of 0.080%), Immigrants from Bulgaria (5.6%, a difference of 0.10%), Immigrants from Netherlands (5.6%, a difference of 0.10%), and Immigrants from Asia (5.6%, a difference of 0.16%).
| Demographics | Rating | Rank | Single Mother Households |
| Immigrants | North Macedonia | 98.6 /100 | #63 | Exceptional 5.6% |
| Immigrants | France | 98.6 /100 | #64 | Exceptional 5.6% |
| Greeks | 98.6 /100 | #65 | Exceptional 5.6% |
| Immigrants | Canada | 98.5 /100 | #66 | Exceptional 5.6% |
| Italians | 98.5 /100 | #67 | Exceptional 5.6% |
| Immigrants | Bulgaria | 98.5 /100 | #68 | Exceptional 5.6% |
| Asians | 98.5 /100 | #69 | Exceptional 5.6% |
| Immigrants | Eastern Europe | 98.4 /100 | #70 | Exceptional 5.6% |
| Immigrants | Kazakhstan | 98.4 /100 | #71 | Exceptional 5.6% |
| Immigrants | Netherlands | 98.4 /100 | #72 | Exceptional 5.6% |
| Immigrants | Asia | 98.4 /100 | #73 | Exceptional 5.6% |
| Immigrants | North America | 98.3 /100 | #74 | Exceptional 5.6% |
| Slovenes | 98.3 /100 | #75 | Exceptional 5.6% |
| New Zealanders | 98.2 /100 | #76 | Exceptional 5.6% |
| Romanians | 98.1 /100 | #77 | Exceptional 5.6% |