Guatemalan vs Inupiat Single Mother Households
COMPARE
Guatemalan
Inupiat
Single Mother Households
Single Mother Households Comparison
Guatemalans
Inupiat
7.7%
SINGLE MOTHER HOUSEHOLDS
0.0/ 100
METRIC RATING
282nd/ 347
METRIC RANK
8.5%
SINGLE MOTHER HOUSEHOLDS
0.0/ 100
METRIC RATING
330th/ 347
METRIC RANK
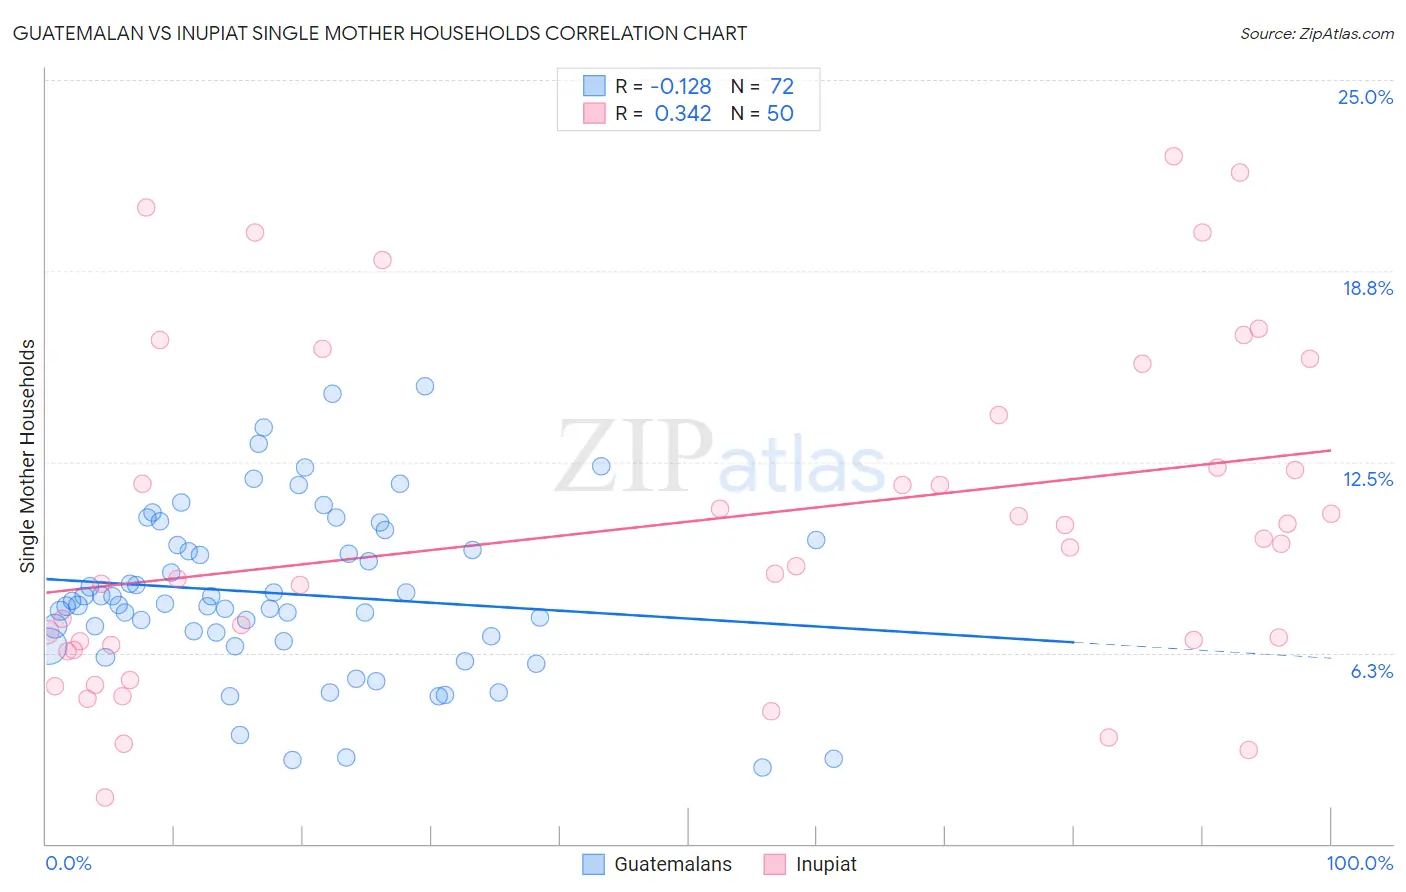
Guatemalan vs Inupiat Single Mother Households Correlation Chart
The statistical analysis conducted on geographies consisting of 408,771,433 people shows a poor negative correlation between the proportion of Guatemalans and percentage of single mother households in the United States with a correlation coefficient (R) of -0.128 and weighted average of 7.7%. Similarly, the statistical analysis conducted on geographies consisting of 96,271,599 people shows a mild positive correlation between the proportion of Inupiat and percentage of single mother households in the United States with a correlation coefficient (R) of 0.342 and weighted average of 8.5%, a difference of 10.7%.
Single Mother Households Correlation Summary
| Measurement | Guatemalan | Inupiat |
| Minimum | 2.5% | 1.5% |
| Maximum | 15.0% | 22.5% |
| Range | 12.5% | 21.0% |
| Mean | 8.2% | 10.5% |
| Median | 7.8% | 9.7% |
| Interquartile 25% (IQ1) | 6.7% | 6.5% |
| Interquartile 75% (IQ3) | 9.9% | 14.0% |
| Interquartile Range (IQR) | 3.1% | 7.5% |
| Standard Deviation (Sample) | 2.7% | 5.4% |
| Standard Deviation (Population) | 2.7% | 5.4% |
Similar Demographics by Single Mother Households
Demographics Similar to Guatemalans by Single Mother Households
In terms of single mother households, the demographic groups most similar to Guatemalans are Immigrants from Sierra Leone (7.7%, a difference of 0.020%), Immigrants from Laos (7.7%, a difference of 0.020%), Nigerian (7.7%, a difference of 0.030%), Immigrants from El Salvador (7.6%, a difference of 0.54%), and Immigrants from Belize (7.7%, a difference of 0.63%).
| Demographics | Rating | Rank | Single Mother Households |
| Central American Indians | 0.1 /100 | #275 | Tragic 7.6% |
| Guyanese | 0.1 /100 | #276 | Tragic 7.6% |
| Immigrants | Trinidad and Tobago | 0.1 /100 | #277 | Tragic 7.6% |
| Central Americans | 0.1 /100 | #278 | Tragic 7.6% |
| Immigrants | El Salvador | 0.0 /100 | #279 | Tragic 7.6% |
| Immigrants | Sierra Leone | 0.0 /100 | #280 | Tragic 7.7% |
| Immigrants | Laos | 0.0 /100 | #281 | Tragic 7.7% |
| Guatemalans | 0.0 /100 | #282 | Tragic 7.7% |
| Nigerians | 0.0 /100 | #283 | Tragic 7.7% |
| Immigrants | Belize | 0.0 /100 | #284 | Tragic 7.7% |
| Trinidadians and Tobagonians | 0.0 /100 | #285 | Tragic 7.7% |
| Immigrants | Middle Africa | 0.0 /100 | #286 | Tragic 7.7% |
| Immigrants | Guatemala | 0.0 /100 | #287 | Tragic 7.7% |
| Sierra Leoneans | 0.0 /100 | #288 | Tragic 7.7% |
| Sub-Saharan Africans | 0.0 /100 | #289 | Tragic 7.8% |
Demographics Similar to Inupiat by Single Mother Households
In terms of single mother households, the demographic groups most similar to Inupiat are Sioux (8.5%, a difference of 0.0%), Hopi (8.5%, a difference of 0.11%), Yakama (8.4%, a difference of 0.85%), Immigrants from Haiti (8.4%, a difference of 1.0%), and British West Indian (8.4%, a difference of 1.2%).
| Demographics | Rating | Rank | Single Mother Households |
| Haitians | 0.0 /100 | #323 | Tragic 8.3% |
| Immigrants | Jamaica | 0.0 /100 | #324 | Tragic 8.4% |
| Immigrants | Caribbean | 0.0 /100 | #325 | Tragic 8.4% |
| British West Indians | 0.0 /100 | #326 | Tragic 8.4% |
| Immigrants | Haiti | 0.0 /100 | #327 | Tragic 8.4% |
| Yakama | 0.0 /100 | #328 | Tragic 8.4% |
| Hopi | 0.0 /100 | #329 | Tragic 8.5% |
| Inupiat | 0.0 /100 | #330 | Tragic 8.5% |
| Sioux | 0.0 /100 | #331 | Tragic 8.5% |
| U.S. Virgin Islanders | 0.0 /100 | #332 | Tragic 8.6% |
| Liberians | 0.0 /100 | #333 | Tragic 8.6% |
| Immigrants | Liberia | 0.0 /100 | #334 | Tragic 8.7% |
| Immigrants | Dominica | 0.0 /100 | #335 | Tragic 8.7% |
| Puerto Ricans | 0.0 /100 | #336 | Tragic 8.7% |
| Navajo | 0.0 /100 | #337 | Tragic 8.8% |