Guamanian/Chamorro vs Immigrants from Somalia Divorced or Separated
COMPARE
Guamanian/Chamorro
Immigrants from Somalia
Divorced or Separated
Divorced or Separated Comparison
Guamanians/Chamorros
Immigrants from Somalia
12.3%
DIVORCED OR SEPARATED
11.3/ 100
METRIC RATING
221st/ 347
METRIC RANK
12.6%
DIVORCED OR SEPARATED
0.6/ 100
METRIC RATING
257th/ 347
METRIC RANK
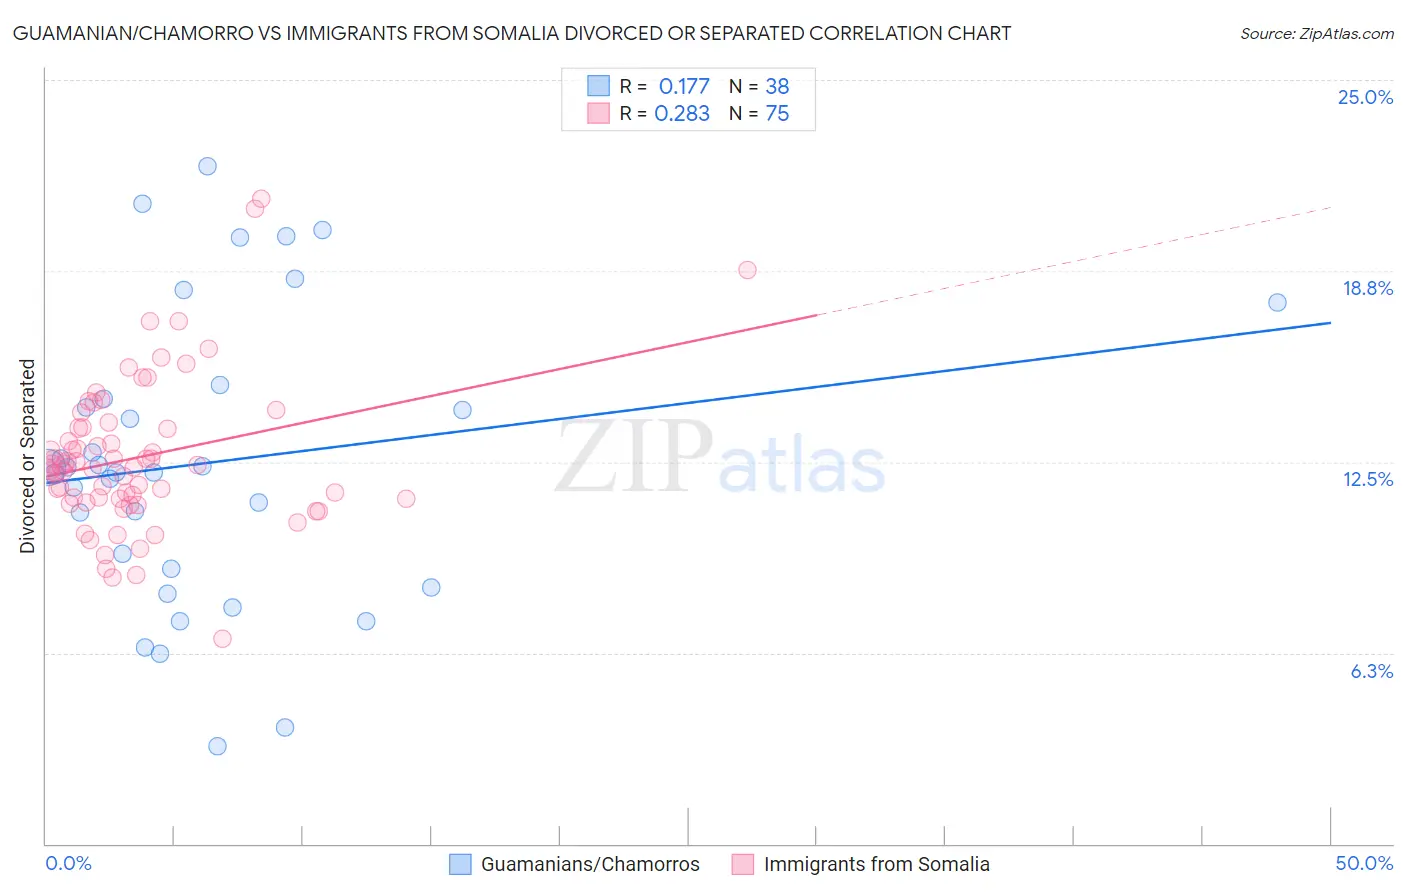
Guamanian/Chamorro vs Immigrants from Somalia Divorced or Separated Correlation Chart
The statistical analysis conducted on geographies consisting of 221,943,719 people shows a poor positive correlation between the proportion of Guamanians/Chamorros and percentage of population currently divorced or separated in the United States with a correlation coefficient (R) of 0.177 and weighted average of 12.3%. Similarly, the statistical analysis conducted on geographies consisting of 92,109,510 people shows a weak positive correlation between the proportion of Immigrants from Somalia and percentage of population currently divorced or separated in the United States with a correlation coefficient (R) of 0.283 and weighted average of 12.6%, a difference of 2.6%.
Divorced or Separated Correlation Summary
| Measurement | Guamanian/Chamorro | Immigrants from Somalia |
| Minimum | 3.2% | 6.7% |
| Maximum | 22.2% | 21.1% |
| Range | 19.0% | 14.4% |
| Mean | 12.5% | 12.7% |
| Median | 12.2% | 12.3% |
| Interquartile 25% (IQ1) | 9.0% | 11.3% |
| Interquartile 75% (IQ3) | 14.6% | 13.6% |
| Interquartile Range (IQR) | 5.6% | 2.3% |
| Standard Deviation (Sample) | 4.7% | 2.5% |
| Standard Deviation (Population) | 4.7% | 2.5% |
Similar Demographics by Divorced or Separated
Demographics Similar to Guamanians/Chamorros by Divorced or Separated
In terms of divorced or separated, the demographic groups most similar to Guamanians/Chamorros are Czechoslovakian (12.3%, a difference of 0.030%), British (12.3%, a difference of 0.030%), Bangladeshi (12.3%, a difference of 0.070%), Scandinavian (12.3%, a difference of 0.080%), and Slovene (12.3%, a difference of 0.15%).
| Demographics | Rating | Rank | Divorced or Separated |
| Immigrants | Argentina | 15.5 /100 | #214 | Poor 12.2% |
| Europeans | 15.4 /100 | #215 | Poor 12.2% |
| Immigrants | South America | 15.4 /100 | #216 | Poor 12.2% |
| Northern Europeans | 14.7 /100 | #217 | Poor 12.2% |
| Slovenes | 13.2 /100 | #218 | Poor 12.3% |
| Czechoslovakians | 11.7 /100 | #219 | Poor 12.3% |
| British | 11.6 /100 | #220 | Poor 12.3% |
| Guamanians/Chamorros | 11.3 /100 | #221 | Poor 12.3% |
| Bangladeshis | 10.5 /100 | #222 | Poor 12.3% |
| Scandinavians | 10.4 /100 | #223 | Poor 12.3% |
| Immigrants | Azores | 9.7 /100 | #224 | Tragic 12.3% |
| Belgians | 9.7 /100 | #225 | Tragic 12.3% |
| Immigrants | Western Africa | 9.3 /100 | #226 | Tragic 12.3% |
| Hmong | 8.8 /100 | #227 | Tragic 12.3% |
| Immigrants | Cameroon | 8.3 /100 | #228 | Tragic 12.3% |
Demographics Similar to Immigrants from Somalia by Divorced or Separated
In terms of divorced or separated, the demographic groups most similar to Immigrants from Somalia are Indonesian (12.6%, a difference of 0.0%), Immigrants from Colombia (12.6%, a difference of 0.010%), Yuman (12.6%, a difference of 0.020%), Immigrants from Uruguay (12.6%, a difference of 0.020%), and Immigrants from Dominica (12.6%, a difference of 0.050%).
| Demographics | Rating | Rank | Divorced or Separated |
| Irish | 1.3 /100 | #250 | Tragic 12.5% |
| Aleuts | 1.3 /100 | #251 | Tragic 12.5% |
| Liberians | 0.9 /100 | #252 | Tragic 12.6% |
| Somalis | 0.9 /100 | #253 | Tragic 12.6% |
| Senegalese | 0.8 /100 | #254 | Tragic 12.6% |
| Welsh | 0.7 /100 | #255 | Tragic 12.6% |
| Immigrants | Colombia | 0.6 /100 | #256 | Tragic 12.6% |
| Immigrants | Somalia | 0.6 /100 | #257 | Tragic 12.6% |
| Indonesians | 0.6 /100 | #258 | Tragic 12.6% |
| Yuman | 0.6 /100 | #259 | Tragic 12.6% |
| Immigrants | Uruguay | 0.6 /100 | #260 | Tragic 12.6% |
| Immigrants | Dominica | 0.5 /100 | #261 | Tragic 12.6% |
| Basques | 0.5 /100 | #262 | Tragic 12.6% |
| Immigrants | Panama | 0.5 /100 | #263 | Tragic 12.6% |
| English | 0.5 /100 | #264 | Tragic 12.6% |