Guamanian/Chamorro vs Estonian Single Mother Households

COMPARE

Guamanian/Chamorro
Race
Ancestry
AfghanAfricanAlaska NativeAlaskan AthabascanAlbanianAleutAlsatianAmericanApacheArabArapahoArgentineanArmenianAssyrian/Chaldean/SyriacAustralianAustrianBahamianBangladeshiBarbadianBasqueBelgianBelizeanBermudanBhutaneseBlackfeetBolivianBrazilianBritishBritish West IndianBulgarianBurmeseCajunCambodianCanadianCape VerdeanCarpatho RusynCelticCentral AmericanCentral American IndianCherokeeCheyenneChickasawChileanChineseChippewaChoctawColombianColvilleComancheCosta RicanCreeCreekCroatianCrowCubanCypriotCzechCzechoslovakianDanishDelawareDominicanDutchDutch West IndianEastern EuropeanEcuadorianEgyptianEnglishEthiopianEuropeanFijianFilipinoFinnishFrenchFrench American IndianFrench CanadianGermanGerman RussianGhanaianGreekGuamanian/ChamorroGuatemalanGuyaneseHaitianHmongHonduranHopiHoumaHungarianIcelanderIndian (Asian)IndonesianInupiatIranianIraqiIrishIroquoisIsraeliItalianJamaicanJapaneseJordanianKenyanKiowaKoreanLaotianLatvianLebaneseLiberianLithuanianLumbeeLuxembourgerMacedonianMalaysianMalteseMarshalleseMenomineeMexicanMexican American IndianMongolianMoroccanNative HawaiianNavajoNepaleseNew ZealanderNicaraguanNigerianNorthern EuropeanNorwegianOkinawanOsageOttawaPaiutePakistaniPalestinianPanamanianParaguayanPennsylvania GermanPeruvianPimaPolishPortuguesePotawatomiPuebloPuerto RicanPuget Sound SalishRomanianRussianSalvadoranSamoanScandinavianScotch-IrishScottishSeminoleSenegaleseSerbianShoshoneSierra LeoneanSiouxSlavicSlovakSloveneSomaliSouth AfricanSouth AmericanSouth American IndianSoviet UnionSpaniardSpanishSpanish AmericanSpanish American IndianSri LankanSubsaharan AfricanSudaneseSwedishSwissSyrianTaiwaneseThaiTlingit-HaidaTohono O'OdhamTonganTrinidadian and TobagonianTsimshianTurkishU.S. Virgin IslanderUgandanUkrainianUruguayanUteVenezuelanVietnameseWelshWest IndianYakamaYaquiYugoslavianYumanYup'ikZimbabwean
Immigration
NonimmigrantsImmigrantsAfghanistanAfricaAlbaniaArgentinaArmeniaAsiaAustraliaAustriaBahamasBangladeshBarbadosBelarusBelgiumBelizeBoliviaBosnia and HerzegovinaBrazilBulgariaBurma/MyanmarCabo VerdeCambodiaCameroonCanadaCaribbeanCentral AmericaChileChinaColombiaCongoCosta RicaCroatiaCubaCzechoslovakiaDenmarkDominicaDominican RepublicEastern AfricaEastern AsiaEastern EuropeEcuadorEgyptEl SalvadorEnglandEritreaEthiopiaEuropeFijiFranceGermanyGhanaGreeceGrenadaGuatemalaGuyanaHaitiHondurasHong KongHungaryIndiaIndonesiaIranIraqIrelandIsraelItalyJamaicaJapanJordanKazakhstanKenyaKoreaKuwaitLaosLatin AmericaLatviaLebanonLiberiaLithuaniaMalaysiaMexicoMicronesiaMiddle AfricaMoldovaMoroccoNepalNetherlandsNicaraguaNigeriaNorth AmericaNorth MacedoniaNorthern AfricaNorthern EuropeNorwayOceaniaPakistanPanamaPeruPhilippinesPolandPortugalRomaniaRussiaSaudi ArabiaScotlandSenegalSerbiaSierra LeoneSingaporeSomaliaSouth AfricaSouth AmericaSouth Central AsiaSouth Eastern AsiaSouthern EuropeSpainSri LankaSt. Vincent and the GrenadinesSudanSwedenSwitzerlandSyriaTaiwanThailandTrinidad and TobagoTurkeyUgandaUkraineUruguayUzbekistanVenezuelaVietnamWest IndiesWestern AfricaWestern AsiaWestern EuropeYemenZaireZimbabweAzores
Estonian
Race
Ancestry
AfghanAfricanAlaska NativeAlaskan AthabascanAlbanianAleutAlsatianAmericanApacheArabArapahoArgentineanArmenianAssyrian/Chaldean/SyriacAustralianAustrianBahamianBangladeshiBarbadianBasqueBelgianBelizeanBermudanBhutaneseBlackfeetBolivianBrazilianBritishBritish West IndianBulgarianBurmeseCajunCambodianCanadianCape VerdeanCarpatho RusynCelticCentral AmericanCentral American IndianCherokeeCheyenneChickasawChileanChineseChippewaChoctawColombianColvilleComancheCosta RicanCreeCreekCroatianCrowCubanCypriotCzechCzechoslovakianDanishDelawareDominicanDutchDutch West IndianEastern EuropeanEcuadorianEgyptianEnglishEstonianEthiopianEuropeanFijianFilipinoFinnishFrenchFrench American IndianFrench CanadianGermanGerman RussianGhanaianGreekGuatemalanGuyaneseHaitianHmongHonduranHopiHoumaHungarianIcelanderIndian (Asian)IndonesianInupiatIranianIraqiIrishIroquoisIsraeliItalianJamaicanJapaneseJordanianKenyanKiowaKoreanLaotianLatvianLebaneseLiberianLithuanianLumbeeLuxembourgerMacedonianMalaysianMalteseMarshalleseMenomineeMexicanMexican American IndianMongolianMoroccanNative HawaiianNavajoNepaleseNew ZealanderNicaraguanNigerianNorthern EuropeanNorwegianOkinawanOsageOttawaPaiutePakistaniPalestinianPanamanianParaguayanPennsylvania GermanPeruvianPimaPolishPortuguesePotawatomiPuebloPuerto RicanPuget Sound SalishRomanianRussianSalvadoranSamoanScandinavianScotch-IrishScottishSeminoleSenegaleseSerbianShoshoneSierra LeoneanSiouxSlavicSlovakSloveneSomaliSouth AfricanSouth AmericanSouth American IndianSoviet UnionSpaniardSpanishSpanish AmericanSpanish American IndianSri LankanSubsaharan AfricanSudaneseSwedishSwissSyrianTaiwaneseThaiTlingit-HaidaTohono O'OdhamTonganTrinidadian and TobagonianTsimshianTurkishU.S. Virgin IslanderUgandanUkrainianUruguayanUteVenezuelanVietnameseWelshWest IndianYakamaYaquiYugoslavianYumanYup'ikZimbabwean
Immigration
NonimmigrantsImmigrantsAfghanistanAfricaAlbaniaArgentinaArmeniaAsiaAustraliaAustriaBahamasBangladeshBarbadosBelarusBelgiumBelizeBoliviaBosnia and HerzegovinaBrazilBulgariaBurma/MyanmarCabo VerdeCambodiaCameroonCanadaCaribbeanCentral AmericaChileChinaColombiaCongoCosta RicaCroatiaCubaCzechoslovakiaDenmarkDominicaDominican RepublicEastern AfricaEastern AsiaEastern EuropeEcuadorEgyptEl SalvadorEnglandEritreaEthiopiaEuropeFijiFranceGermanyGhanaGreeceGrenadaGuatemalaGuyanaHaitiHondurasHong KongHungaryIndiaIndonesiaIranIraqIrelandIsraelItalyJamaicaJapanJordanKazakhstanKenyaKoreaKuwaitLaosLatin AmericaLatviaLebanonLiberiaLithuaniaMalaysiaMexicoMicronesiaMiddle AfricaMoldovaMoroccoNepalNetherlandsNicaraguaNigeriaNorth AmericaNorth MacedoniaNorthern AfricaNorthern EuropeNorwayOceaniaPakistanPanamaPeruPhilippinesPolandPortugalRomaniaRussiaSaudi ArabiaScotlandSenegalSerbiaSierra LeoneSingaporeSomaliaSouth AfricaSouth AmericaSouth Central AsiaSouth Eastern AsiaSouthern EuropeSpainSri LankaSt. Vincent and the GrenadinesSudanSwedenSwitzerlandSyriaTaiwanThailandTrinidad and TobagoTurkeyUgandaUkraineUruguayUzbekistanVenezuelaVietnamWest IndiesWestern AfricaWestern AsiaWestern EuropeYemenZaireZimbabweAzores
Single Mother Households
Income
Poverty
Unemployment
Labor Participation
Family Structure
Vehicle Availability
Education Level
Disability

Single Mother Households Comparison

Guamanians/Chamorros

Estonians

Poor
Exceptional
6.6%
SINGLE MOTHER HOUSEHOLDS
12.4/ 100
METRIC RATING
202nd/ 347
METRIC RANK
5.4%
SINGLE MOTHER HOUSEHOLDS
99.6/ 100
METRIC RATING
40th/ 347
METRIC RANK

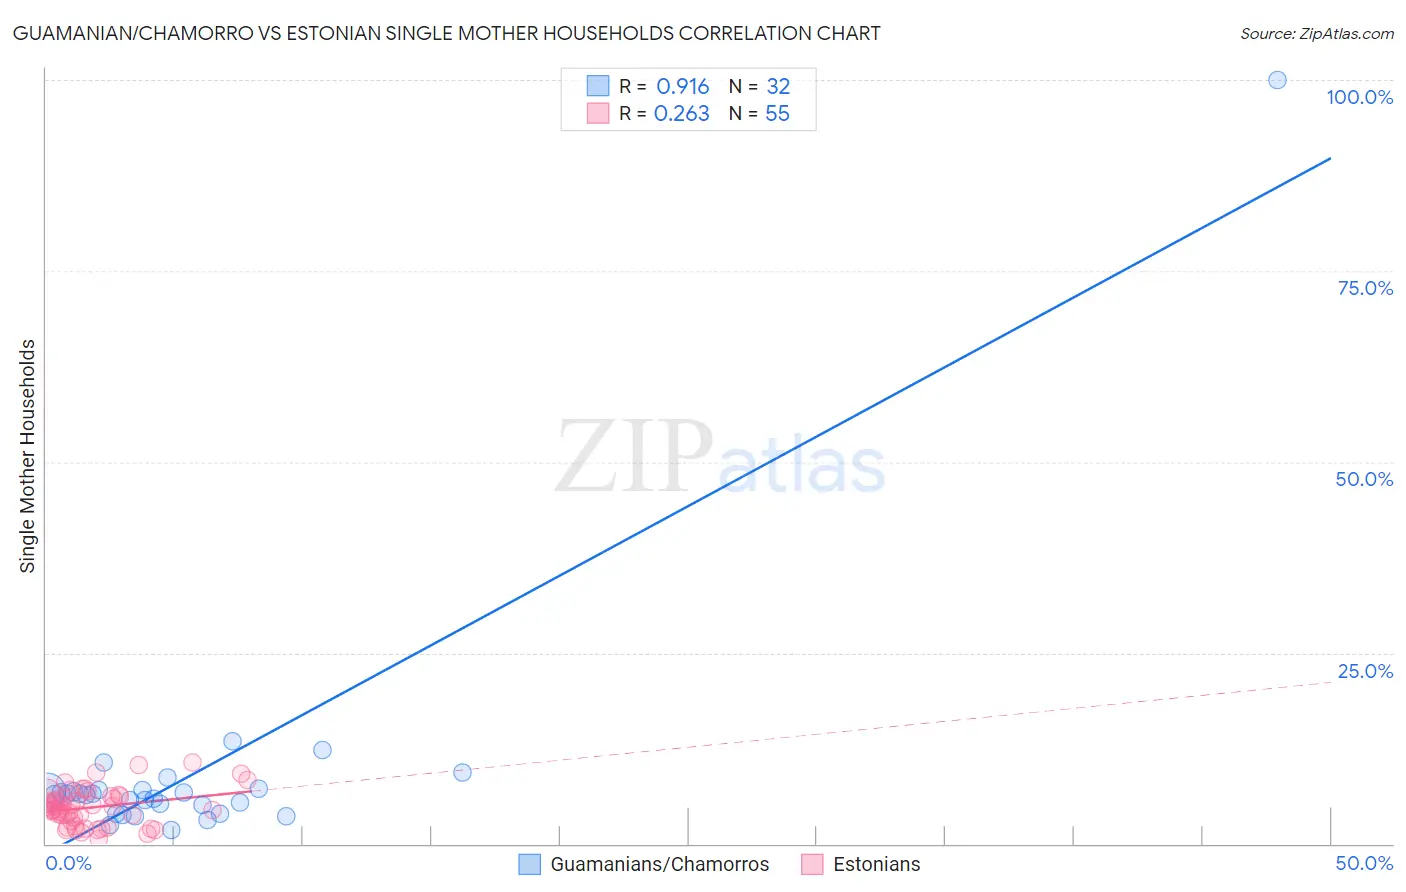
Guamanian/Chamorro vs Estonian Single Mother Households Correlation Chart

The statistical analysis conducted on geographies consisting of 221,648,092 people shows a near-perfect positive correlation between the proportion of Guamanians/Chamorros and percentage of single mother households in the United States with a correlation coefficient (R) of 0.916 and weighted average of 6.6%. Similarly, the statistical analysis conducted on geographies consisting of 123,346,647 people shows a weak positive correlation between the proportion of Estonians and percentage of single mother households in the United States with a correlation coefficient (R) of 0.263 and weighted average of 5.4%, a difference of 23.9%.
Guamanian/Chamorro vs Estonian Single Mother Households

Single Mother Households Correlation Summary

MeasurementGuamanian/ChamorroEstonian
Minimum1.8%0.68%
Maximum100.0%10.6%
Range98.2%9.9%
Mean9.2%4.8%
Median6.4%4.6%
Interquartile 25% (IQ1)4.5%2.9%
Interquartile 75% (IQ3)7.1%6.3%
Interquartile Range (IQR)2.5%3.4%
Standard Deviation (Sample)16.8%2.4%
Standard Deviation (Population)16.5%2.3%

Similar Demographics by Single Mother Households

Demographics Similar to Guamanians/Chamorros by Single Mother Households

In terms of single mother households, the demographic groups most similar to Guamanians/Chamorros are Immigrants from Peru (6.7%, a difference of 0.090%), Immigrants from Fiji (6.7%, a difference of 0.11%), Venezuelan (6.6%, a difference of 0.12%), Cree (6.7%, a difference of 0.13%), and German Russian (6.7%, a difference of 0.21%).
DemographicsRating | RankSingle Mother Households
South Americans
18.0
/100
|
#195
Poor
6.6%
Uruguayans
18.0
/100
|
#196
Poor
6.6%
Moroccans
17.4
/100
|
#197
Poor
6.6%
Hawaiians
16.1
/100
|
#198
Poor
6.6%
Potawatomi
15.5
/100
|
#199
Poor
6.6%
Immigrants | Ethiopia
14.7
/100
|
#200
Poor
6.6%
Venezuelans
12.9
/100
|
#201
Poor
6.6%
Guamanians/Chamorros
12.4
/100
|
#202
Poor
6.6%
Immigrants | Peru
12.0
/100
|
#203
Poor
6.7%
Immigrants | Fiji
11.9
/100
|
#204
Poor
6.7%
Cree
11.9
/100
|
#205
Poor
6.7%
German Russians
11.5
/100
|
#206
Poor
6.7%
Immigrants | South America
11.5
/100
|
#207
Poor
6.7%
Vietnamese
11.3
/100
|
#208
Poor
6.7%
Immigrants | Colombia
10.5
/100
|
#209
Poor
6.7%

Demographics Similar to Estonians by Single Mother Households

In terms of single mother households, the demographic groups most similar to Estonians are Immigrants from Sweden (5.4%, a difference of 0.11%), Immigrants from Serbia (5.4%, a difference of 0.25%), Immigrants from Greece (5.4%, a difference of 0.42%), Macedonian (5.4%, a difference of 0.50%), and Immigrants from South Central Asia (5.4%, a difference of 0.56%).
DemographicsRating | RankSingle Mother Households
Immigrants | Switzerland
99.7
/100
|
#33
Exceptional
5.3%
Bulgarians
99.7
/100
|
#34
Exceptional
5.3%
Immigrants | Northern Europe
99.7
/100
|
#35
Exceptional
5.3%
Immigrants | Czechoslovakia
99.7
/100
|
#36
Exceptional
5.3%
Immigrants | Belgium
99.7
/100
|
#37
Exceptional
5.3%
Immigrants | Serbia
99.6
/100
|
#38
Exceptional
5.4%
Immigrants | Sweden
99.6
/100
|
#39
Exceptional
5.4%
Estonians
99.6
/100
|
#40
Exceptional
5.4%
Immigrants | Greece
99.5
/100
|
#41
Exceptional
5.4%
Macedonians
99.5
/100
|
#42
Exceptional
5.4%
Immigrants | South Central Asia
99.5
/100
|
#43
Exceptional
5.4%
Lithuanians
99.4
/100
|
#44
Exceptional
5.4%
Immigrants | Croatia
99.4
/100
|
#45
Exceptional
5.4%
Croatians
99.3
/100
|
#46
Exceptional
5.5%
Norwegians
99.3
/100
|
#47
Exceptional
5.5%