Greek vs South African Family Households with Children
COMPARE
Greek
South African
Family Households with Children
Family Households with Children Comparison
Greeks
South Africans
27.1%
FAMILY HOUSEHOLDS WITH CHILDREN
11.4/ 100
METRIC RATING
218th/ 347
METRIC RANK
27.4%
FAMILY HOUSEHOLDS WITH CHILDREN
44.9/ 100
METRIC RATING
183rd/ 347
METRIC RANK
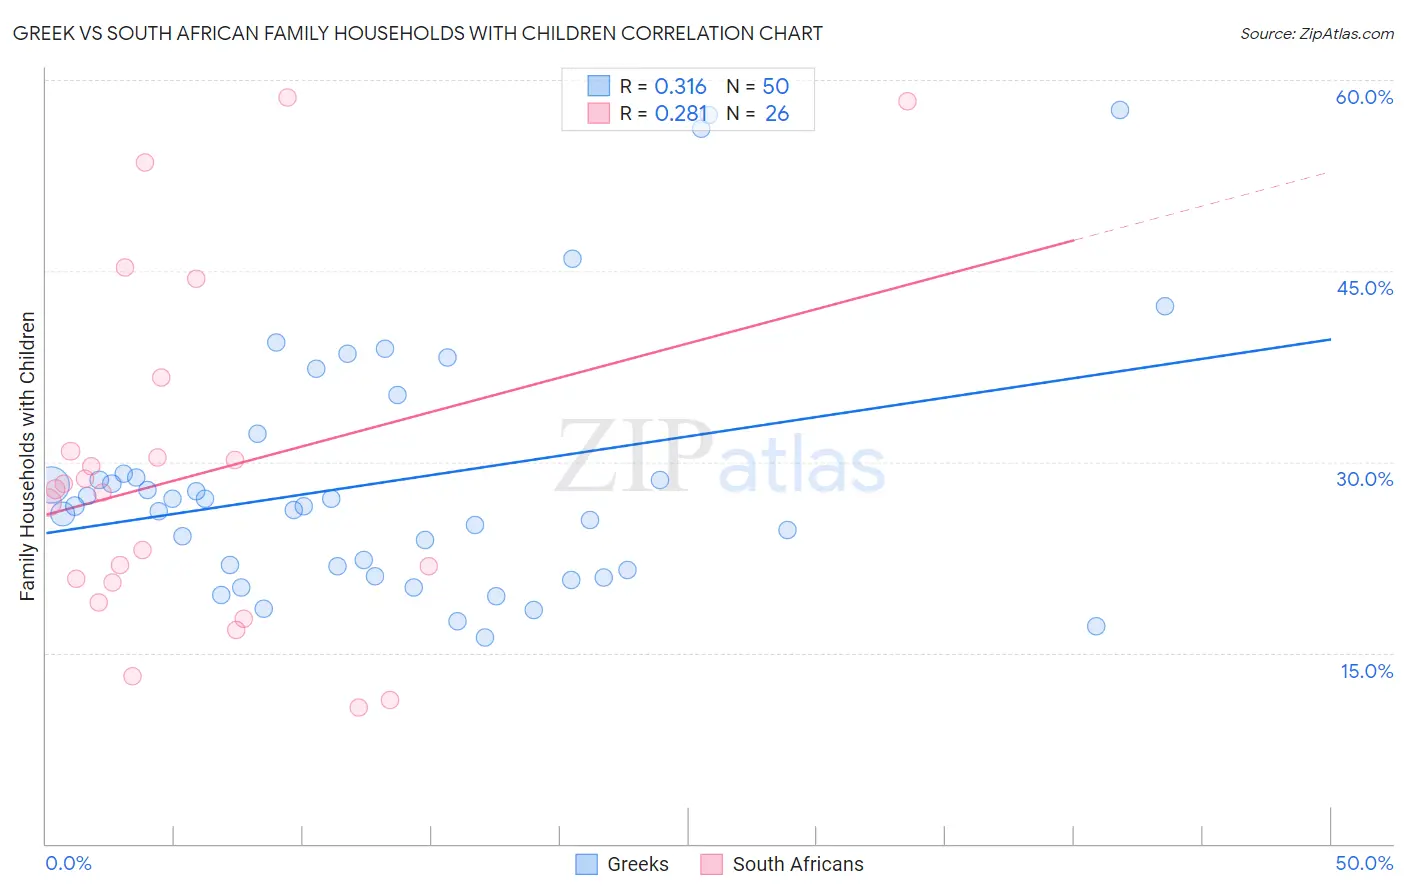
Greek vs South African Family Households with Children Correlation Chart
The statistical analysis conducted on geographies consisting of 482,098,294 people shows a mild positive correlation between the proportion of Greeks and percentage of family households with children in the United States with a correlation coefficient (R) of 0.316 and weighted average of 27.1%. Similarly, the statistical analysis conducted on geographies consisting of 182,473,583 people shows a weak positive correlation between the proportion of South Africans and percentage of family households with children in the United States with a correlation coefficient (R) of 0.281 and weighted average of 27.4%, a difference of 1.0%.
Family Households with Children Correlation Summary
| Measurement | Greek | South African |
| Minimum | 16.2% | 10.7% |
| Maximum | 57.7% | 58.7% |
| Range | 41.5% | 47.9% |
| Mean | 28.5% | 29.0% |
| Median | 26.5% | 27.7% |
| Interquartile 25% (IQ1) | 21.5% | 20.5% |
| Interquartile 75% (IQ3) | 29.1% | 30.8% |
| Interquartile Range (IQR) | 7.6% | 10.3% |
| Standard Deviation (Sample) | 10.0% | 13.4% |
| Standard Deviation (Population) | 9.9% | 13.1% |
Similar Demographics by Family Households with Children
Demographics Similar to Greeks by Family Households with Children
In terms of family households with children, the demographic groups most similar to Greeks are Cuban (27.1%, a difference of 0.040%), U.S. Virgin Islander (27.1%, a difference of 0.040%), Immigrants from Japan (27.1%, a difference of 0.040%), African (27.2%, a difference of 0.080%), and Northern European (27.2%, a difference of 0.080%).
| Demographics | Rating | Rank | Family Households with Children |
| Welsh | 14.2 /100 | #211 | Poor 27.2% |
| Immigrants | Dominica | 13.9 /100 | #212 | Poor 27.2% |
| Okinawans | 13.7 /100 | #213 | Poor 27.2% |
| Africans | 13.0 /100 | #214 | Poor 27.2% |
| Northern Europeans | 12.8 /100 | #215 | Poor 27.2% |
| Cubans | 12.2 /100 | #216 | Poor 27.1% |
| U.S. Virgin Islanders | 12.1 /100 | #217 | Poor 27.1% |
| Greeks | 11.4 /100 | #218 | Poor 27.1% |
| Immigrants | Japan | 10.7 /100 | #219 | Poor 27.1% |
| Austrians | 9.9 /100 | #220 | Tragic 27.1% |
| New Zealanders | 9.6 /100 | #221 | Tragic 27.1% |
| Paraguayans | 9.4 /100 | #222 | Tragic 27.1% |
| Pima | 9.2 /100 | #223 | Tragic 27.1% |
| Germans | 8.7 /100 | #224 | Tragic 27.1% |
| Canadians | 7.5 /100 | #225 | Tragic 27.1% |
Demographics Similar to South Africans by Family Households with Children
In terms of family households with children, the demographic groups most similar to South Africans are Native Hawaiian (27.4%, a difference of 0.010%), Puget Sound Salish (27.4%, a difference of 0.030%), Aleut (27.4%, a difference of 0.040%), Turkish (27.4%, a difference of 0.050%), and Immigrants from Turkey (27.4%, a difference of 0.050%).
| Demographics | Rating | Rank | Family Households with Children |
| Immigrants | China | 49.6 /100 | #176 | Average 27.4% |
| Ugandans | 49.2 /100 | #177 | Average 27.4% |
| Spanish Americans | 48.9 /100 | #178 | Average 27.4% |
| Turks | 46.9 /100 | #179 | Average 27.4% |
| Immigrants | Turkey | 46.9 /100 | #180 | Average 27.4% |
| Aleuts | 46.7 /100 | #181 | Average 27.4% |
| Puget Sound Salish | 46.2 /100 | #182 | Average 27.4% |
| South Africans | 44.9 /100 | #183 | Average 27.4% |
| Native Hawaiians | 44.6 /100 | #184 | Average 27.4% |
| Delaware | 42.0 /100 | #185 | Average 27.4% |
| Immigrants | Brazil | 40.6 /100 | #186 | Average 27.4% |
| Creek | 39.8 /100 | #187 | Fair 27.4% |
| Dutch | 38.8 /100 | #188 | Fair 27.4% |
| Immigrants | Israel | 37.9 /100 | #189 | Fair 27.4% |
| Immigrants | Uruguay | 37.7 /100 | #190 | Fair 27.4% |