Ghanaian vs Immigrants from Congo Family Households with Children
COMPARE
Ghanaian
Immigrants from Congo
Family Households with Children
Family Households with Children Comparison
Ghanaians
Immigrants from Congo
28.5%
FAMILY HOUSEHOLDS WITH CHILDREN
99.9/ 100
METRIC RATING
67th/ 347
METRIC RANK
27.3%
FAMILY HOUSEHOLDS WITH CHILDREN
28.7/ 100
METRIC RATING
200th/ 347
METRIC RANK
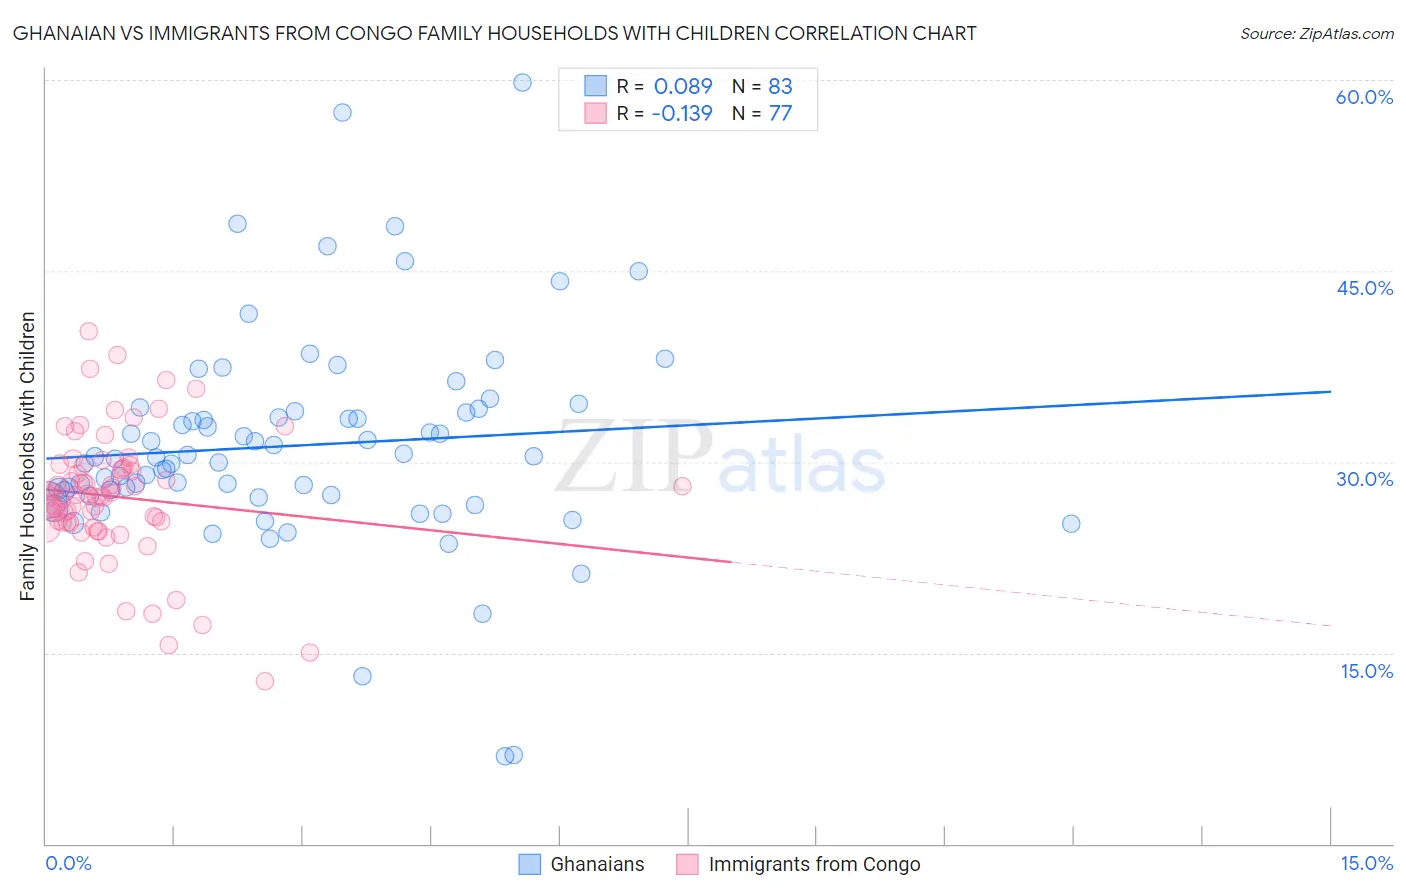
Ghanaian vs Immigrants from Congo Family Households with Children Correlation Chart
The statistical analysis conducted on geographies consisting of 190,475,172 people shows a slight positive correlation between the proportion of Ghanaians and percentage of family households with children in the United States with a correlation coefficient (R) of 0.089 and weighted average of 28.5%. Similarly, the statistical analysis conducted on geographies consisting of 92,083,447 people shows a poor negative correlation between the proportion of Immigrants from Congo and percentage of family households with children in the United States with a correlation coefficient (R) of -0.139 and weighted average of 27.3%, a difference of 4.4%.
Family Households with Children Correlation Summary
| Measurement | Ghanaian | Immigrants from Congo |
| Minimum | 6.8% | 12.8% |
| Maximum | 59.8% | 40.2% |
| Range | 53.0% | 27.4% |
| Mean | 31.3% | 27.3% |
| Median | 30.4% | 27.3% |
| Interquartile 25% (IQ1) | 27.3% | 25.2% |
| Interquartile 75% (IQ3) | 34.0% | 29.6% |
| Interquartile Range (IQR) | 6.7% | 4.4% |
| Standard Deviation (Sample) | 8.4% | 5.0% |
| Standard Deviation (Population) | 8.4% | 5.0% |
Similar Demographics by Family Households with Children
Demographics Similar to Ghanaians by Family Households with Children
In terms of family households with children, the demographic groups most similar to Ghanaians are Immigrants from Egypt (28.5%, a difference of 0.0%), Honduran (28.5%, a difference of 0.010%), Houma (28.5%, a difference of 0.020%), Immigrants from Korea (28.5%, a difference of 0.040%), and Filipino (28.6%, a difference of 0.090%).
| Demographics | Rating | Rank | Family Households with Children |
| Hmong | 99.9 /100 | #60 | Exceptional 28.6% |
| Immigrants | Ghana | 99.9 /100 | #61 | Exceptional 28.6% |
| Egyptians | 99.9 /100 | #62 | Exceptional 28.6% |
| Immigrants | Lebanon | 99.9 /100 | #63 | Exceptional 28.6% |
| Filipinos | 99.9 /100 | #64 | Exceptional 28.6% |
| Hondurans | 99.9 /100 | #65 | Exceptional 28.5% |
| Immigrants | Egypt | 99.9 /100 | #66 | Exceptional 28.5% |
| Ghanaians | 99.9 /100 | #67 | Exceptional 28.5% |
| Houma | 99.9 /100 | #68 | Exceptional 28.5% |
| Immigrants | Korea | 99.9 /100 | #69 | Exceptional 28.5% |
| Immigrants | Honduras | 99.9 /100 | #70 | Exceptional 28.5% |
| Burmese | 99.9 /100 | #71 | Exceptional 28.5% |
| Immigrants | Indonesia | 99.9 /100 | #72 | Exceptional 28.5% |
| Iraqis | 99.9 /100 | #73 | Exceptional 28.5% |
| Laotians | 99.9 /100 | #74 | Exceptional 28.5% |
Demographics Similar to Immigrants from Congo by Family Households with Children
In terms of family households with children, the demographic groups most similar to Immigrants from Congo are English (27.3%, a difference of 0.090%), Bhutanese (27.3%, a difference of 0.10%), Immigrants from Romania (27.4%, a difference of 0.15%), Cheyenne (27.4%, a difference of 0.16%), and Norwegian (27.4%, a difference of 0.16%).
| Demographics | Rating | Rank | Family Households with Children |
| Swedes | 36.9 /100 | #193 | Fair 27.4% |
| Immigrants | Iran | 36.1 /100 | #194 | Fair 27.4% |
| Crow | 35.7 /100 | #195 | Fair 27.4% |
| Cheyenne | 35.1 /100 | #196 | Fair 27.4% |
| Norwegians | 35.0 /100 | #197 | Fair 27.4% |
| Immigrants | Romania | 34.4 /100 | #198 | Fair 27.4% |
| English | 32.0 /100 | #199 | Fair 27.3% |
| Immigrants | Congo | 28.7 /100 | #200 | Fair 27.3% |
| Bhutanese | 25.1 /100 | #201 | Fair 27.3% |
| Americans | 22.8 /100 | #202 | Fair 27.3% |
| Kiowa | 22.2 /100 | #203 | Fair 27.3% |
| Immigrants | Sudan | 21.6 /100 | #204 | Fair 27.3% |
| Immigrants | Haiti | 20.3 /100 | #205 | Fair 27.2% |
| Immigrants | Micronesia | 20.2 /100 | #206 | Fair 27.2% |
| Haitians | 19.8 /100 | #207 | Poor 27.2% |