Ghanaian vs Bolivian Births to Unmarried Women
COMPARE
Ghanaian
Bolivian
Births to Unmarried Women
Births to Unmarried Women Comparison
Ghanaians
Bolivians
34.3%
BIRTHS TO UNMARRIED WOMEN
3.1/ 100
METRIC RATING
230th/ 347
METRIC RANK
28.5%
BIRTHS TO UNMARRIED WOMEN
98.7/ 100
METRIC RATING
69th/ 347
METRIC RANK
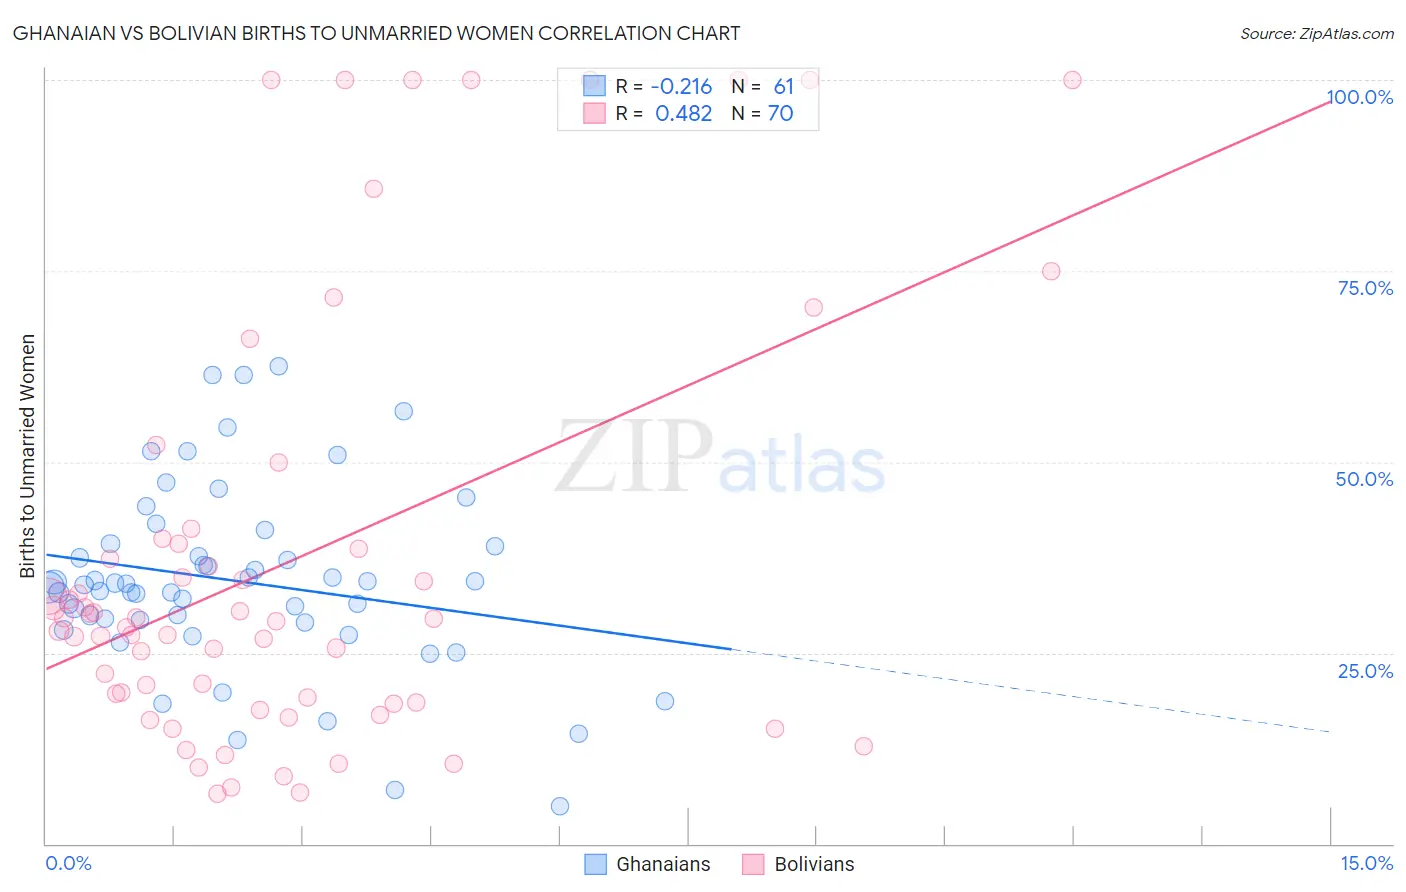
Ghanaian vs Bolivian Births to Unmarried Women Correlation Chart
The statistical analysis conducted on geographies consisting of 184,401,191 people shows a weak negative correlation between the proportion of Ghanaians and percentage of births to unmarried women in the United States with a correlation coefficient (R) of -0.216 and weighted average of 34.3%. Similarly, the statistical analysis conducted on geographies consisting of 177,966,984 people shows a moderate positive correlation between the proportion of Bolivians and percentage of births to unmarried women in the United States with a correlation coefficient (R) of 0.482 and weighted average of 28.5%, a difference of 20.4%.
Births to Unmarried Women Correlation Summary
| Measurement | Ghanaian | Bolivian |
| Minimum | 4.9% | 6.5% |
| Maximum | 62.6% | 100.0% |
| Range | 57.7% | 93.5% |
| Mean | 34.4% | 37.1% |
| Median | 33.9% | 29.4% |
| Interquartile 25% (IQ1) | 29.2% | 18.5% |
| Interquartile 75% (IQ3) | 39.1% | 39.3% |
| Interquartile Range (IQR) | 9.9% | 20.8% |
| Standard Deviation (Sample) | 12.1% | 27.8% |
| Standard Deviation (Population) | 12.0% | 27.6% |
Similar Demographics by Births to Unmarried Women
Demographics Similar to Ghanaians by Births to Unmarried Women
In terms of births to unmarried women, the demographic groups most similar to Ghanaians are Immigrants from Sierra Leone (34.2%, a difference of 0.020%), Panamanian (34.2%, a difference of 0.13%), Native Hawaiian (34.3%, a difference of 0.14%), Immigrants from Panama (34.2%, a difference of 0.17%), and Delaware (34.2%, a difference of 0.18%).
| Demographics | Rating | Rank | Births to Unmarried Women |
| Pennsylvania Germans | 4.3 /100 | #223 | Tragic 34.0% |
| Immigrants | Laos | 4.3 /100 | #224 | Tragic 34.0% |
| Spanish | 4.0 /100 | #225 | Tragic 34.1% |
| Delaware | 3.3 /100 | #226 | Tragic 34.2% |
| Immigrants | Panama | 3.3 /100 | #227 | Tragic 34.2% |
| Panamanians | 3.3 /100 | #228 | Tragic 34.2% |
| Immigrants | Sierra Leone | 3.1 /100 | #229 | Tragic 34.2% |
| Ghanaians | 3.1 /100 | #230 | Tragic 34.3% |
| Native Hawaiians | 2.9 /100 | #231 | Tragic 34.3% |
| French Canadians | 2.5 /100 | #232 | Tragic 34.4% |
| Bangladeshis | 2.5 /100 | #233 | Tragic 34.4% |
| Immigrants | Zaire | 2.3 /100 | #234 | Tragic 34.5% |
| Immigrants | Ghana | 2.2 /100 | #235 | Tragic 34.5% |
| Immigrants | Cameroon | 1.6 /100 | #236 | Tragic 34.7% |
| Marshallese | 1.6 /100 | #237 | Tragic 34.8% |
Demographics Similar to Bolivians by Births to Unmarried Women
In terms of births to unmarried women, the demographic groups most similar to Bolivians are Immigrants from Europe (28.4%, a difference of 0.040%), Laotian (28.5%, a difference of 0.060%), Palestinian (28.4%, a difference of 0.090%), Immigrants from Egypt (28.4%, a difference of 0.20%), and Immigrants from Czechoslovakia (28.4%, a difference of 0.22%).
| Demographics | Rating | Rank | Births to Unmarried Women |
| Egyptians | 99.0 /100 | #62 | Exceptional 28.2% |
| Immigrants | Serbia | 98.9 /100 | #63 | Exceptional 28.3% |
| Tongans | 98.8 /100 | #64 | Exceptional 28.4% |
| Immigrants | Czechoslovakia | 98.8 /100 | #65 | Exceptional 28.4% |
| Immigrants | Egypt | 98.8 /100 | #66 | Exceptional 28.4% |
| Palestinians | 98.7 /100 | #67 | Exceptional 28.4% |
| Immigrants | Europe | 98.7 /100 | #68 | Exceptional 28.4% |
| Bolivians | 98.7 /100 | #69 | Exceptional 28.5% |
| Laotians | 98.6 /100 | #70 | Exceptional 28.5% |
| Jordanians | 98.5 /100 | #71 | Exceptional 28.5% |
| Immigrants | Sweden | 98.5 /100 | #72 | Exceptional 28.5% |
| Albanians | 98.5 /100 | #73 | Exceptional 28.5% |
| Immigrants | Bolivia | 98.5 /100 | #74 | Exceptional 28.6% |
| Immigrants | Switzerland | 98.4 /100 | #75 | Exceptional 28.6% |
| Israelis | 98.4 /100 | #76 | Exceptional 28.6% |