German vs Immigrants from Malaysia Single Mother Households
COMPARE
German
Immigrants from Malaysia
Single Mother Households
Single Mother Households Comparison
Germans
Immigrants from Malaysia
5.8%
SINGLE MOTHER HOUSEHOLDS
96.2/ 100
METRIC RATING
101st/ 347
METRIC RANK
5.7%
SINGLE MOTHER HOUSEHOLDS
97.8/ 100
METRIC RATING
82nd/ 347
METRIC RANK
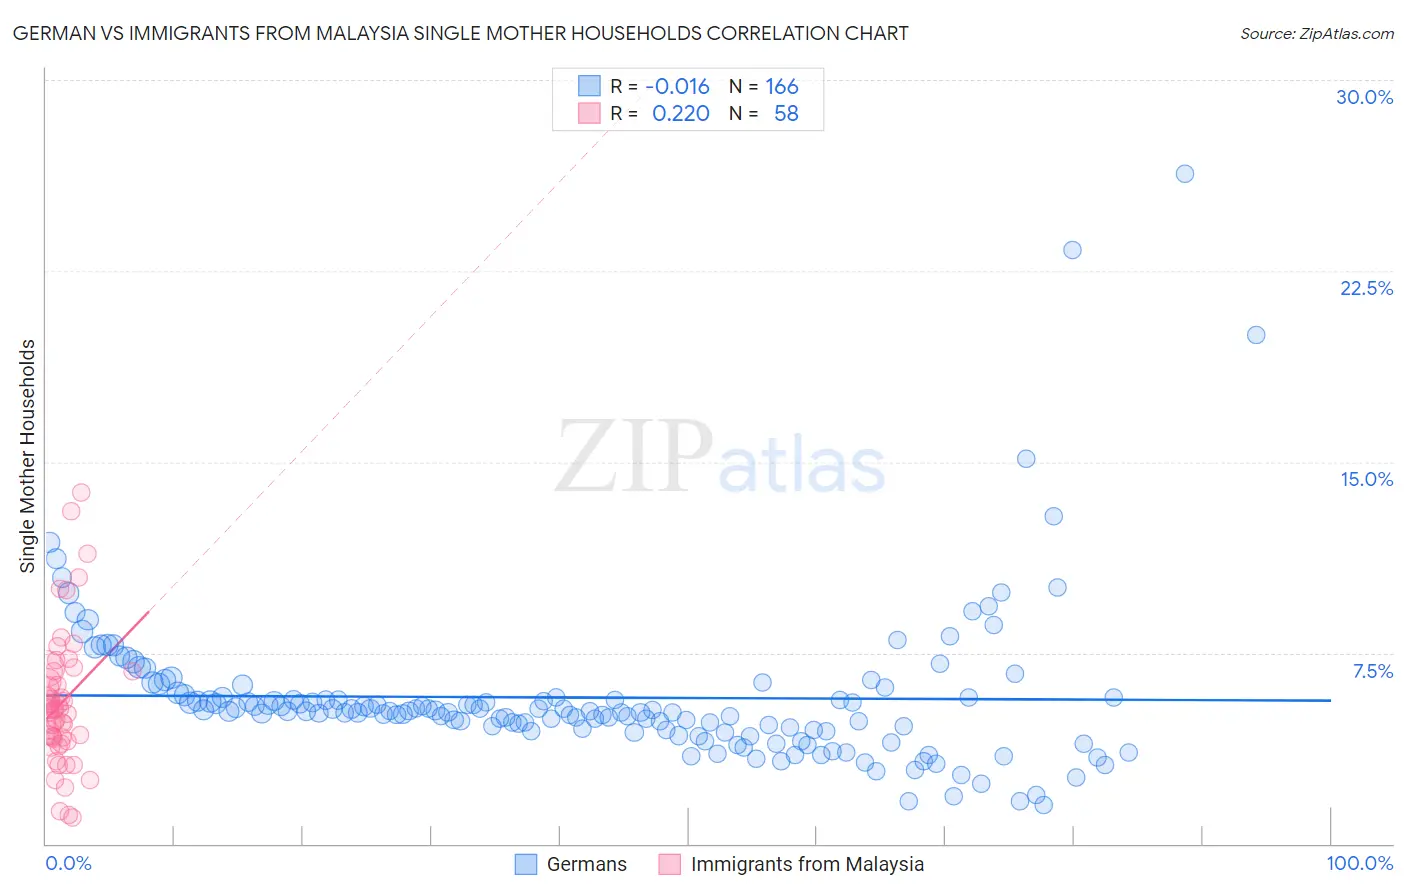
German vs Immigrants from Malaysia Single Mother Households Correlation Chart
The statistical analysis conducted on geographies consisting of 574,074,235 people shows no correlation between the proportion of Germans and percentage of single mother households in the United States with a correlation coefficient (R) of -0.016 and weighted average of 5.8%. Similarly, the statistical analysis conducted on geographies consisting of 197,805,360 people shows a weak positive correlation between the proportion of Immigrants from Malaysia and percentage of single mother households in the United States with a correlation coefficient (R) of 0.220 and weighted average of 5.7%, a difference of 1.7%.
Single Mother Households Correlation Summary
| Measurement | German | Immigrants from Malaysia |
| Minimum | 1.5% | 1.0% |
| Maximum | 26.3% | 13.8% |
| Range | 24.8% | 12.7% |
| Mean | 5.7% | 5.5% |
| Median | 5.2% | 5.3% |
| Interquartile 25% (IQ1) | 4.5% | 4.1% |
| Interquartile 75% (IQ3) | 5.8% | 6.8% |
| Interquartile Range (IQR) | 1.3% | 2.6% |
| Standard Deviation (Sample) | 3.1% | 2.6% |
| Standard Deviation (Population) | 3.1% | 2.6% |
Demographics Similar to Germans and Immigrants from Malaysia by Single Mother Households
In terms of single mother households, the demographic groups most similar to Germans are Scandinavian (5.8%, a difference of 0.030%), Immigrants from Poland (5.8%, a difference of 0.040%), Immigrants from South Africa (5.7%, a difference of 0.10%), Tlingit-Haida (5.7%, a difference of 0.14%), and Austrian (5.7%, a difference of 0.19%). Similarly, the demographic groups most similar to Immigrants from Malaysia are Immigrants from Hungary (5.7%, a difference of 0.030%), Carpatho Rusyn (5.7%, a difference of 0.10%), Immigrants from Moldova (5.6%, a difference of 0.21%), Hungarian (5.7%, a difference of 0.25%), and Finnish (5.7%, a difference of 0.28%).
| Demographics | Rating | Rank | Single Mother Households |
| Immigrants | Moldova | 97.9 /100 | #81 | Exceptional 5.6% |
| Immigrants | Malaysia | 97.8 /100 | #82 | Exceptional 5.7% |
| Immigrants | Hungary | 97.8 /100 | #83 | Exceptional 5.7% |
| Carpatho Rusyns | 97.7 /100 | #84 | Exceptional 5.7% |
| Hungarians | 97.6 /100 | #85 | Exceptional 5.7% |
| Finns | 97.6 /100 | #86 | Exceptional 5.7% |
| Immigrants | Turkey | 97.5 /100 | #87 | Exceptional 5.7% |
| Israelis | 97.4 /100 | #88 | Exceptional 5.7% |
| Ukrainians | 97.2 /100 | #89 | Exceptional 5.7% |
| Immigrants | Indonesia | 97.2 /100 | #90 | Exceptional 5.7% |
| Europeans | 97.0 /100 | #91 | Exceptional 5.7% |
| Immigrants | Western Asia | 96.7 /100 | #92 | Exceptional 5.7% |
| Serbians | 96.7 /100 | #93 | Exceptional 5.7% |
| Basques | 96.7 /100 | #94 | Exceptional 5.7% |
| Slovaks | 96.6 /100 | #95 | Exceptional 5.7% |
| Austrians | 96.4 /100 | #96 | Exceptional 5.7% |
| Tlingit-Haida | 96.4 /100 | #97 | Exceptional 5.7% |
| Immigrants | South Africa | 96.3 /100 | #98 | Exceptional 5.7% |
| Immigrants | Poland | 96.3 /100 | #99 | Exceptional 5.8% |
| Scandinavians | 96.2 /100 | #100 | Exceptional 5.8% |
| Germans | 96.2 /100 | #101 | Exceptional 5.8% |