German Russian vs Sioux Family Households with Children
COMPARE
German Russian
Sioux
Family Households with Children
Family Households with Children Comparison
German Russians
Sioux
26.8%
FAMILY HOUSEHOLDS WITH CHILDREN
1.5/ 100
METRIC RATING
255th/ 347
METRIC RANK
28.1%
FAMILY HOUSEHOLDS WITH CHILDREN
98.3/ 100
METRIC RATING
104th/ 347
METRIC RANK
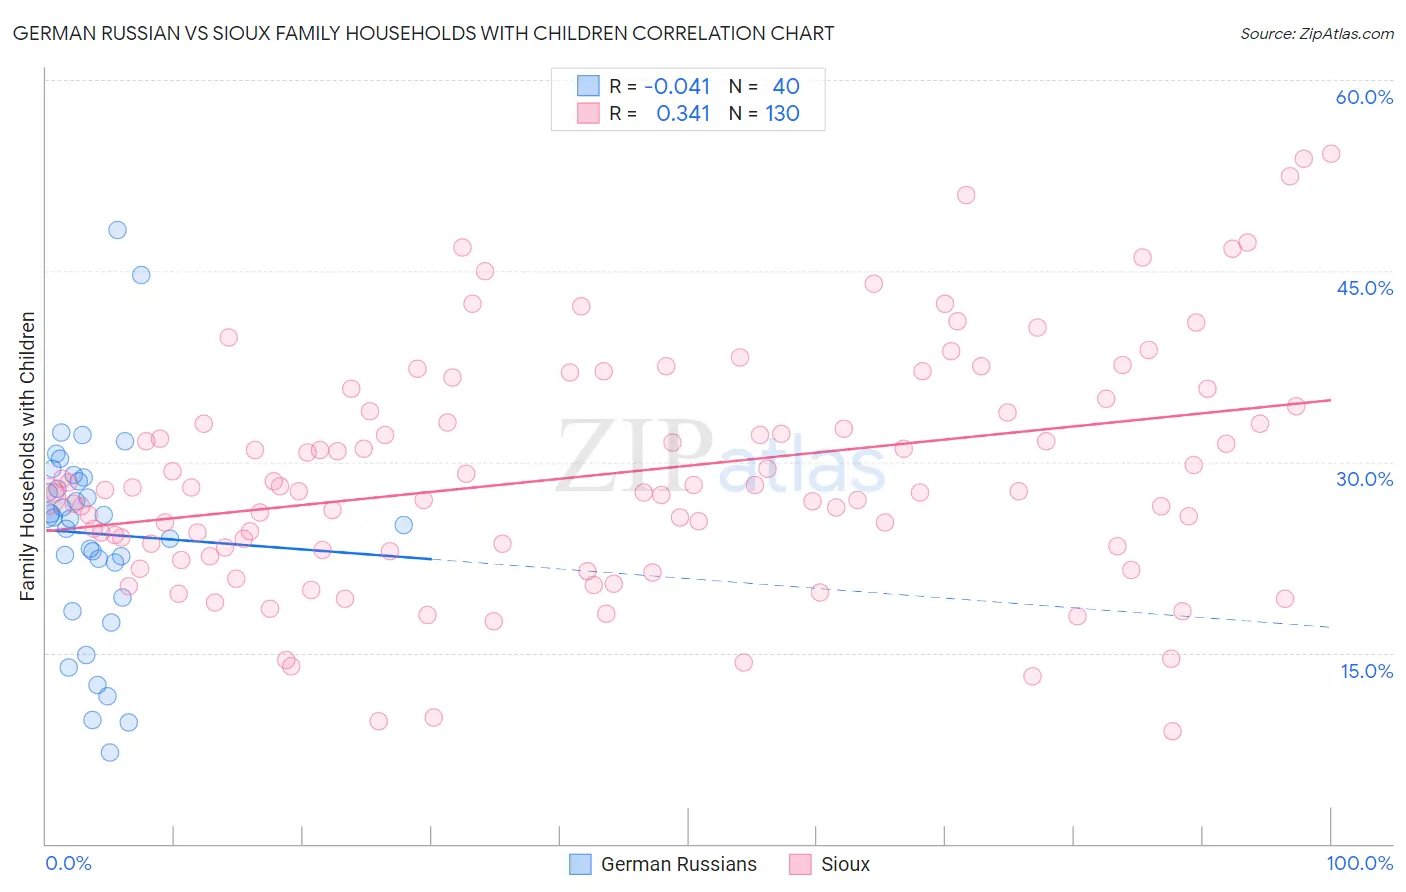
German Russian vs Sioux Family Households with Children Correlation Chart
The statistical analysis conducted on geographies consisting of 96,442,482 people shows no correlation between the proportion of German Russians and percentage of family households with children in the United States with a correlation coefficient (R) of -0.041 and weighted average of 26.8%. Similarly, the statistical analysis conducted on geographies consisting of 234,087,425 people shows a mild positive correlation between the proportion of Sioux and percentage of family households with children in the United States with a correlation coefficient (R) of 0.341 and weighted average of 28.1%, a difference of 4.7%.
Family Households with Children Correlation Summary
| Measurement | German Russian | Sioux |
| Minimum | 7.2% | 8.8% |
| Maximum | 48.2% | 54.2% |
| Range | 41.0% | 45.4% |
| Mean | 24.4% | 29.0% |
| Median | 25.6% | 27.8% |
| Interquartile 25% (IQ1) | 20.7% | 23.3% |
| Interquartile 75% (IQ3) | 28.7% | 34.0% |
| Interquartile Range (IQR) | 7.9% | 10.7% |
| Standard Deviation (Sample) | 8.4% | 9.2% |
| Standard Deviation (Population) | 8.3% | 9.2% |
Similar Demographics by Family Households with Children
Demographics Similar to German Russians by Family Households with Children
In terms of family households with children, the demographic groups most similar to German Russians are Immigrants from Scotland (26.8%, a difference of 0.0%), Scotch-Irish (26.8%, a difference of 0.010%), Italian (26.8%, a difference of 0.030%), Slavic (26.8%, a difference of 0.060%), and Immigrants from Cuba (26.8%, a difference of 0.070%).
| Demographics | Rating | Rank | Family Households with Children |
| Immigrants | Kazakhstan | 2.2 /100 | #248 | Tragic 26.9% |
| Immigrants | Eastern Europe | 2.1 /100 | #249 | Tragic 26.9% |
| Belgians | 2.1 /100 | #250 | Tragic 26.9% |
| Immigrants | Bosnia and Herzegovina | 1.9 /100 | #251 | Tragic 26.8% |
| Irish | 1.8 /100 | #252 | Tragic 26.8% |
| Italians | 1.5 /100 | #253 | Tragic 26.8% |
| Immigrants | Scotland | 1.5 /100 | #254 | Tragic 26.8% |
| German Russians | 1.5 /100 | #255 | Tragic 26.8% |
| Scotch-Irish | 1.4 /100 | #256 | Tragic 26.8% |
| Slavs | 1.3 /100 | #257 | Tragic 26.8% |
| Immigrants | Cuba | 1.3 /100 | #258 | Tragic 26.8% |
| Immigrants | Lithuania | 1.2 /100 | #259 | Tragic 26.8% |
| Immigrants | Jamaica | 1.2 /100 | #260 | Tragic 26.8% |
| Immigrants | Belarus | 1.1 /100 | #261 | Tragic 26.8% |
| Immigrants | Russia | 1.0 /100 | #262 | Tragic 26.8% |
Demographics Similar to Sioux by Family Households with Children
In terms of family households with children, the demographic groups most similar to Sioux are Choctaw (28.1%, a difference of 0.0%), Palestinian (28.1%, a difference of 0.050%), Immigrants from South America (28.0%, a difference of 0.11%), Assyrian/Chaldean/Syriac (28.1%, a difference of 0.15%), and Immigrants from Uganda (28.0%, a difference of 0.17%).
| Demographics | Rating | Rank | Family Households with Children |
| Chileans | 98.9 /100 | #97 | Exceptional 28.1% |
| Immigrants | Kenya | 98.9 /100 | #98 | Exceptional 28.1% |
| Immigrants | Azores | 98.8 /100 | #99 | Exceptional 28.1% |
| Indonesians | 98.8 /100 | #100 | Exceptional 28.1% |
| Immigrants | Oceania | 98.8 /100 | #101 | Exceptional 28.1% |
| Assyrians/Chaldeans/Syriacs | 98.7 /100 | #102 | Exceptional 28.1% |
| Palestinians | 98.5 /100 | #103 | Exceptional 28.1% |
| Sioux | 98.3 /100 | #104 | Exceptional 28.1% |
| Choctaw | 98.3 /100 | #105 | Exceptional 28.1% |
| Immigrants | South America | 98.0 /100 | #106 | Exceptional 28.0% |
| Immigrants | Uganda | 97.7 /100 | #107 | Exceptional 28.0% |
| Immigrants | Burma/Myanmar | 97.7 /100 | #108 | Exceptional 28.0% |
| Tohono O'odham | 97.6 /100 | #109 | Exceptional 28.0% |
| Spaniards | 97.4 /100 | #110 | Exceptional 28.0% |
| Scandinavians | 97.1 /100 | #111 | Exceptional 28.0% |