French vs Immigrants from Panama Births to Unmarried Women
COMPARE
French
Immigrants from Panama
Births to Unmarried Women
Births to Unmarried Women Comparison
French
Immigrants from Panama
33.4%
BIRTHS TO UNMARRIED WOMEN
8.7/ 100
METRIC RATING
215th/ 347
METRIC RANK
34.2%
BIRTHS TO UNMARRIED WOMEN
3.3/ 100
METRIC RATING
227th/ 347
METRIC RANK
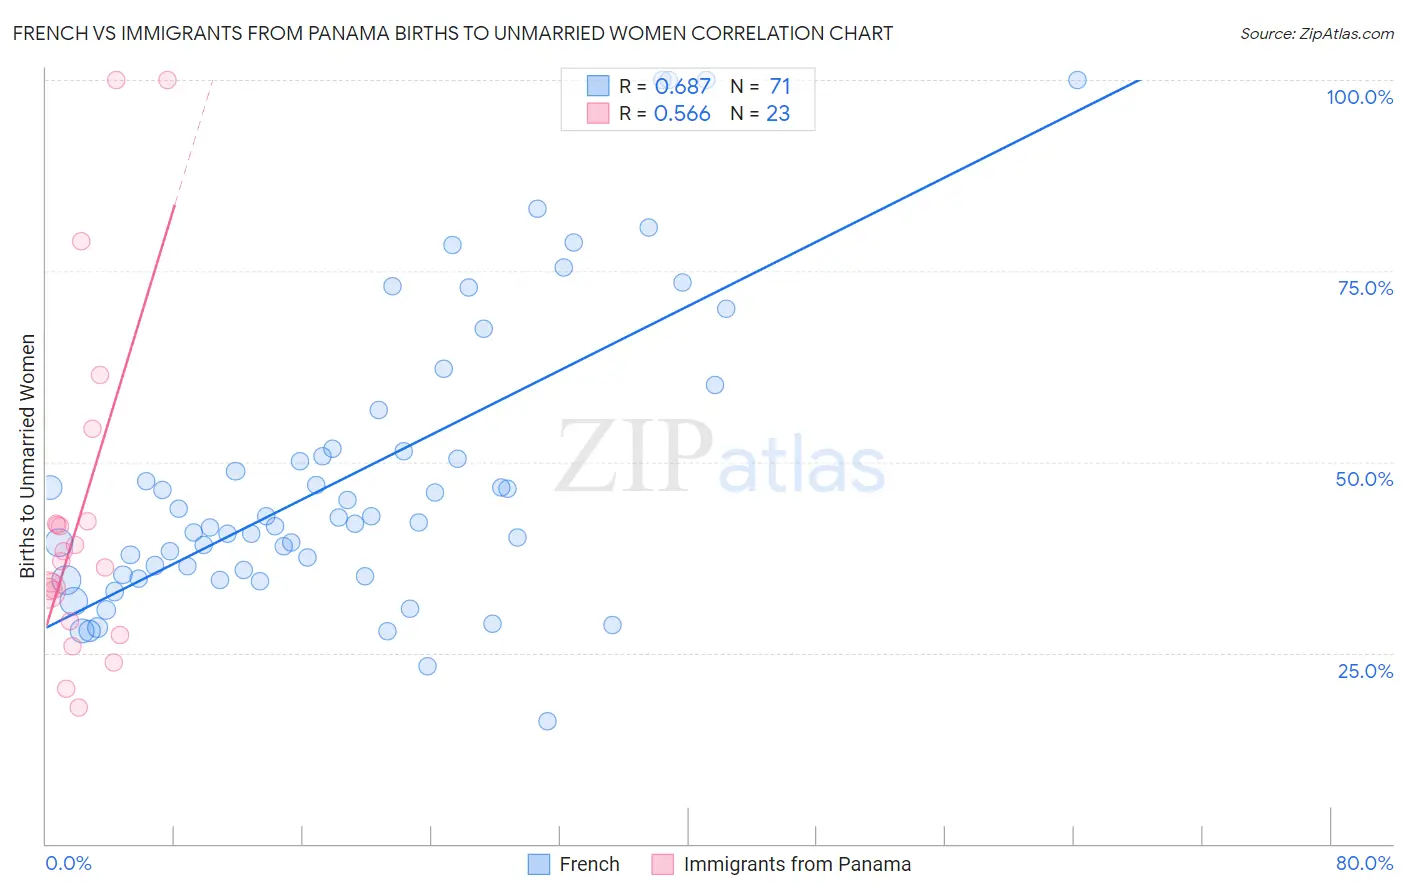
French vs Immigrants from Panama Births to Unmarried Women Correlation Chart
The statistical analysis conducted on geographies consisting of 506,671,877 people shows a significant positive correlation between the proportion of French and percentage of births to unmarried women in the United States with a correlation coefficient (R) of 0.687 and weighted average of 33.4%. Similarly, the statistical analysis conducted on geographies consisting of 213,926,652 people shows a substantial positive correlation between the proportion of Immigrants from Panama and percentage of births to unmarried women in the United States with a correlation coefficient (R) of 0.566 and weighted average of 34.2%, a difference of 2.3%.
Births to Unmarried Women Correlation Summary
| Measurement | French | Immigrants from Panama |
| Minimum | 16.0% | 17.8% |
| Maximum | 100.0% | 100.0% |
| Range | 84.0% | 82.2% |
| Mean | 48.3% | 43.1% |
| Median | 42.1% | 36.9% |
| Interquartile 25% (IQ1) | 35.2% | 29.1% |
| Interquartile 75% (IQ3) | 51.7% | 42.2% |
| Interquartile Range (IQR) | 16.5% | 13.1% |
| Standard Deviation (Sample) | 19.5% | 22.4% |
| Standard Deviation (Population) | 19.4% | 21.9% |
Demographics Similar to French and Immigrants from Panama by Births to Unmarried Women
In terms of births to unmarried women, the demographic groups most similar to French are Slovak (33.4%, a difference of 0.18%), Immigrants from Costa Rica (33.4%, a difference of 0.22%), Nepalese (33.5%, a difference of 0.27%), Celtic (33.3%, a difference of 0.41%), and Ecuadorian (33.3%, a difference of 0.48%). Similarly, the demographic groups most similar to Immigrants from Panama are Delaware (34.2%, a difference of 0.010%), Panamanian (34.2%, a difference of 0.030%), Immigrants from Sierra Leone (34.2%, a difference of 0.14%), Ghanaian (34.3%, a difference of 0.17%), and Native Hawaiian (34.3%, a difference of 0.31%).
| Demographics | Rating | Rank | Births to Unmarried Women |
| Ecuadorians | 10.5 /100 | #211 | Poor 33.3% |
| Celtics | 10.2 /100 | #212 | Poor 33.3% |
| Immigrants | Costa Rica | 9.5 /100 | #213 | Tragic 33.4% |
| Slovaks | 9.3 /100 | #214 | Tragic 33.4% |
| French | 8.7 /100 | #215 | Tragic 33.4% |
| Nepalese | 7.8 /100 | #216 | Tragic 33.5% |
| Spaniards | 7.0 /100 | #217 | Tragic 33.6% |
| Immigrants | Ecuador | 5.9 /100 | #218 | Tragic 33.7% |
| Alsatians | 5.4 /100 | #219 | Tragic 33.8% |
| Portuguese | 5.4 /100 | #220 | Tragic 33.8% |
| Malaysians | 5.0 /100 | #221 | Tragic 33.9% |
| Immigrants | Uruguay | 4.8 /100 | #222 | Tragic 33.9% |
| Pennsylvania Germans | 4.3 /100 | #223 | Tragic 34.0% |
| Immigrants | Laos | 4.3 /100 | #224 | Tragic 34.0% |
| Spanish | 4.0 /100 | #225 | Tragic 34.1% |
| Delaware | 3.3 /100 | #226 | Tragic 34.2% |
| Immigrants | Panama | 3.3 /100 | #227 | Tragic 34.2% |
| Panamanians | 3.3 /100 | #228 | Tragic 34.2% |
| Immigrants | Sierra Leone | 3.1 /100 | #229 | Tragic 34.2% |
| Ghanaians | 3.1 /100 | #230 | Tragic 34.3% |
| Native Hawaiians | 2.9 /100 | #231 | Tragic 34.3% |