French American Indian vs Immigrants from Argentina Married-couple Households
COMPARE
French American Indian
Immigrants from Argentina
Married-couple Households
Married-couple Households Comparison
French American Indians
Immigrants from Argentina
44.1%
MARRIED-COUPLE HOUSEHOLDS
0.4/ 100
METRIC RATING
250th/ 347
METRIC RANK
47.2%
MARRIED-COUPLE HOUSEHOLDS
86.0/ 100
METRIC RATING
135th/ 347
METRIC RANK
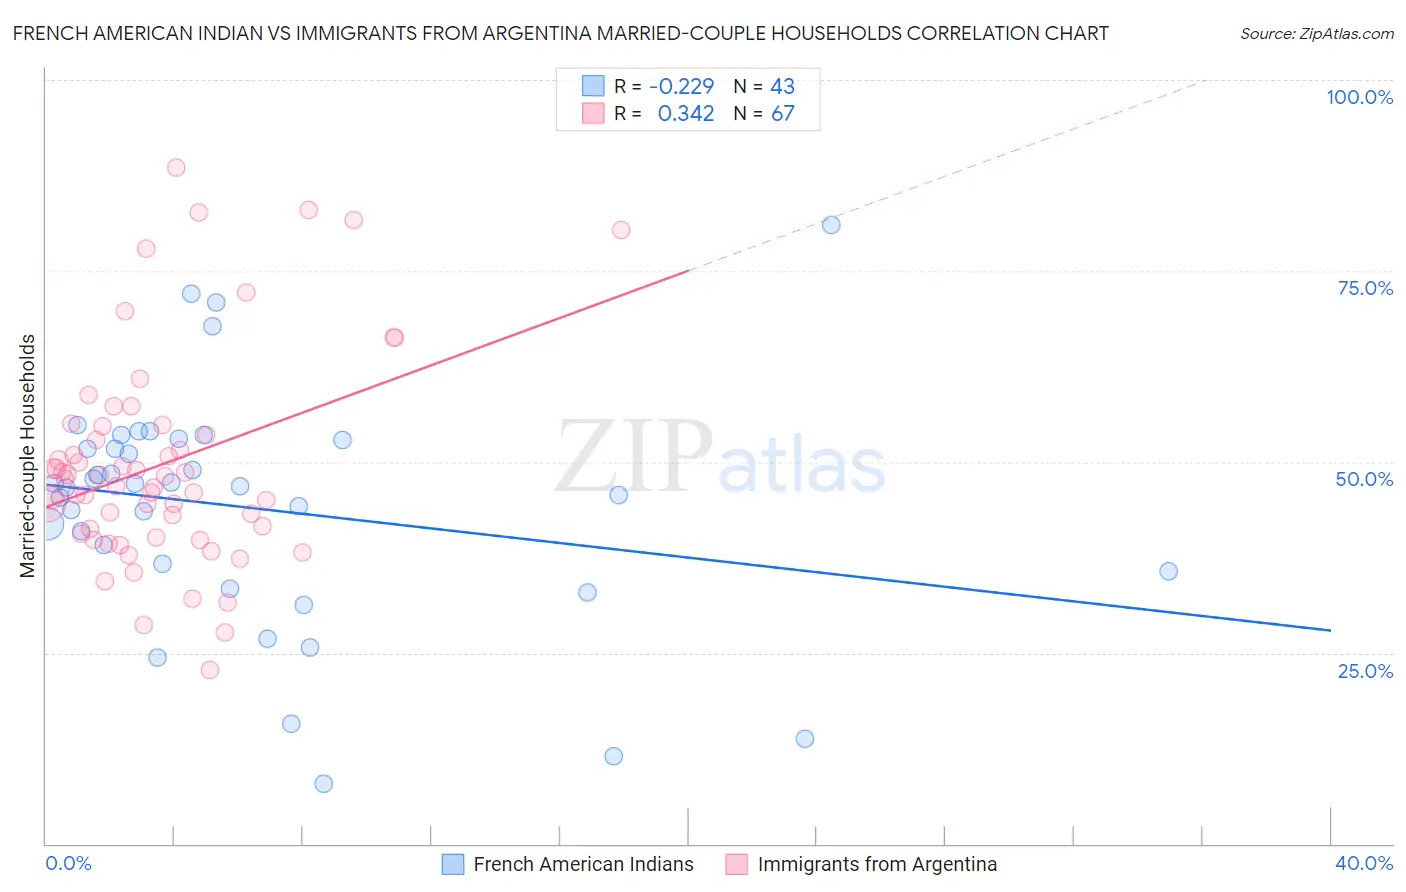
French American Indian vs Immigrants from Argentina Married-couple Households Correlation Chart
The statistical analysis conducted on geographies consisting of 131,960,385 people shows a weak negative correlation between the proportion of French American Indians and percentage of married-couple family households in the United States with a correlation coefficient (R) of -0.229 and weighted average of 44.1%. Similarly, the statistical analysis conducted on geographies consisting of 264,359,680 people shows a mild positive correlation between the proportion of Immigrants from Argentina and percentage of married-couple family households in the United States with a correlation coefficient (R) of 0.342 and weighted average of 47.2%, a difference of 7.2%.
Married-couple Households Correlation Summary
| Measurement | French American Indian | Immigrants from Argentina |
| Minimum | 7.9% | 22.7% |
| Maximum | 81.0% | 88.5% |
| Range | 73.1% | 65.8% |
| Mean | 44.0% | 49.7% |
| Median | 46.8% | 47.9% |
| Interquartile 25% (IQ1) | 35.7% | 40.5% |
| Interquartile 75% (IQ3) | 52.8% | 54.6% |
| Interquartile Range (IQR) | 17.1% | 14.1% |
| Standard Deviation (Sample) | 15.5% | 13.9% |
| Standard Deviation (Population) | 15.3% | 13.8% |
Similar Demographics by Married-couple Households
Demographics Similar to French American Indians by Married-couple Households
In terms of married-couple households, the demographic groups most similar to French American Indians are Immigrants from Kenya (44.1%, a difference of 0.010%), Yup'ik (44.1%, a difference of 0.050%), German Russian (44.0%, a difference of 0.080%), Seminole (44.0%, a difference of 0.15%), and Central American (43.9%, a difference of 0.27%).
| Demographics | Rating | Rank | Married-couple Households |
| Immigrants | Saudi Arabia | 0.9 /100 | #243 | Tragic 44.4% |
| Immigrants | Armenia | 0.7 /100 | #244 | Tragic 44.3% |
| Immigrants | El Salvador | 0.7 /100 | #245 | Tragic 44.3% |
| Immigrants | Cuba | 0.6 /100 | #246 | Tragic 44.2% |
| Immigrants | Morocco | 0.6 /100 | #247 | Tragic 44.2% |
| Yup'ik | 0.4 /100 | #248 | Tragic 44.1% |
| Immigrants | Kenya | 0.4 /100 | #249 | Tragic 44.1% |
| French American Indians | 0.4 /100 | #250 | Tragic 44.1% |
| German Russians | 0.4 /100 | #251 | Tragic 44.0% |
| Seminole | 0.4 /100 | #252 | Tragic 44.0% |
| Central Americans | 0.3 /100 | #253 | Tragic 43.9% |
| Apache | 0.3 /100 | #254 | Tragic 43.9% |
| Shoshone | 0.3 /100 | #255 | Tragic 43.9% |
| Ugandans | 0.3 /100 | #256 | Tragic 43.8% |
| Blackfeet | 0.2 /100 | #257 | Tragic 43.8% |
Demographics Similar to Immigrants from Argentina by Married-couple Households
In terms of married-couple households, the demographic groups most similar to Immigrants from Argentina are Immigrants from Greece (47.2%, a difference of 0.0%), South African (47.3%, a difference of 0.040%), New Zealander (47.2%, a difference of 0.050%), Immigrants from Ukraine (47.3%, a difference of 0.060%), and Immigrants from Malaysia (47.2%, a difference of 0.060%).
| Demographics | Rating | Rank | Married-couple Households |
| Immigrants | Peru | 87.9 /100 | #128 | Excellent 47.3% |
| Immigrants | Iraq | 87.8 /100 | #129 | Excellent 47.3% |
| Immigrants | Hungary | 87.8 /100 | #130 | Excellent 47.3% |
| Immigrants | Denmark | 87.5 /100 | #131 | Excellent 47.3% |
| Immigrants | Ukraine | 86.7 /100 | #132 | Excellent 47.3% |
| South Africans | 86.4 /100 | #133 | Excellent 47.3% |
| Immigrants | Greece | 86.0 /100 | #134 | Excellent 47.2% |
| Immigrants | Argentina | 86.0 /100 | #135 | Excellent 47.2% |
| New Zealanders | 85.3 /100 | #136 | Excellent 47.2% |
| Immigrants | Malaysia | 85.2 /100 | #137 | Excellent 47.2% |
| Immigrants | Afghanistan | 85.1 /100 | #138 | Excellent 47.2% |
| Immigrants | Sweden | 84.7 /100 | #139 | Excellent 47.2% |
| Spanish | 84.5 /100 | #140 | Excellent 47.2% |
| Costa Ricans | 84.4 /100 | #141 | Excellent 47.2% |
| Spaniards | 84.1 /100 | #142 | Excellent 47.2% |