Egyptian vs Immigrants from Sweden Family Households

COMPARE

Egyptian
Race
Ancestry
AfghanAfricanAlaska NativeAlaskan AthabascanAlbanianAleutAlsatianAmericanApacheArabArapahoArgentineanArmenianAssyrian/Chaldean/SyriacAustralianAustrianBahamianBangladeshiBarbadianBasqueBelgianBelizeanBermudanBhutaneseBlackfeetBolivianBrazilianBritishBritish West IndianBulgarianBurmeseCajunCambodianCanadianCape VerdeanCarpatho RusynCelticCentral AmericanCentral American IndianCherokeeCheyenneChickasawChileanChineseChippewaChoctawColombianColvilleComancheCosta RicanCreeCreekCroatianCrowCubanCypriotCzechCzechoslovakianDanishDelawareDominicanDutchDutch West IndianEastern EuropeanEcuadorianEgyptianEnglishEstonianEthiopianEuropeanFijianFilipinoFinnishFrenchFrench American IndianFrench CanadianGermanGerman RussianGhanaianGreekGuamanian/ChamorroGuatemalanGuyaneseHaitianHmongHonduranHopiHoumaHungarianIcelanderIndian (Asian)IndonesianInupiatIranianIraqiIrishIroquoisIsraeliItalianJamaicanJapaneseJordanianKenyanKiowaKoreanLaotianLatvianLebaneseLiberianLithuanianLumbeeLuxembourgerMacedonianMalaysianMalteseMarshalleseMenomineeMexicanMexican American IndianMongolianMoroccanNative HawaiianNavajoNepaleseNew ZealanderNicaraguanNigerianNorthern EuropeanNorwegianOkinawanOsageOttawaPaiutePakistaniPalestinianPanamanianParaguayanPennsylvania GermanPeruvianPimaPolishPortuguesePotawatomiPuebloPuerto RicanPuget Sound SalishRomanianRussianSalvadoranSamoanScandinavianScotch-IrishScottishSeminoleSenegaleseSerbianShoshoneSierra LeoneanSiouxSlavicSlovakSloveneSomaliSouth AfricanSouth AmericanSouth American IndianSoviet UnionSpaniardSpanishSpanish AmericanSpanish American IndianSri LankanSubsaharan AfricanSudaneseSwedishSwissSyrianTaiwaneseThaiTlingit-HaidaTohono O'OdhamTonganTrinidadian and TobagonianTsimshianTurkishU.S. Virgin IslanderUgandanUkrainianUruguayanUteVenezuelanVietnameseWelshWest IndianYakamaYaquiYugoslavianYumanYup'ikZimbabwean
Immigration
NonimmigrantsImmigrantsAfghanistanAfricaAlbaniaArgentinaArmeniaAsiaAustraliaAustriaBahamasBangladeshBarbadosBelarusBelgiumBelizeBoliviaBosnia and HerzegovinaBrazilBulgariaBurma/MyanmarCabo VerdeCambodiaCameroonCanadaCaribbeanCentral AmericaChileChinaColombiaCongoCosta RicaCroatiaCubaCzechoslovakiaDenmarkDominicaDominican RepublicEastern AfricaEastern AsiaEastern EuropeEcuadorEgyptEl SalvadorEnglandEritreaEthiopiaEuropeFijiFranceGermanyGhanaGreeceGrenadaGuatemalaGuyanaHaitiHondurasHong KongHungaryIndiaIndonesiaIranIraqIrelandIsraelItalyJamaicaJapanJordanKazakhstanKenyaKoreaKuwaitLaosLatin AmericaLatviaLebanonLiberiaLithuaniaMalaysiaMexicoMicronesiaMiddle AfricaMoldovaMoroccoNepalNetherlandsNicaraguaNigeriaNorth AmericaNorth MacedoniaNorthern AfricaNorthern EuropeNorwayOceaniaPakistanPanamaPeruPhilippinesPolandPortugalRomaniaRussiaSaudi ArabiaScotlandSenegalSerbiaSierra LeoneSingaporeSomaliaSouth AfricaSouth AmericaSouth Central AsiaSouth Eastern AsiaSouthern EuropeSpainSri LankaSt. Vincent and the GrenadinesSudanSwitzerlandSyriaTaiwanThailandTrinidad and TobagoTurkeyUgandaUkraineUruguayUzbekistanVenezuelaVietnamWest IndiesWestern AfricaWestern AsiaWestern EuropeYemenZaireZimbabweAzores
Immigrants from Sweden
Race
Ancestry
AfghanAfricanAlaska NativeAlaskan AthabascanAlbanianAleutAlsatianAmericanApacheArabArapahoArgentineanArmenianAssyrian/Chaldean/SyriacAustralianAustrianBahamianBangladeshiBarbadianBasqueBelgianBelizeanBermudanBhutaneseBlackfeetBolivianBrazilianBritishBritish West IndianBulgarianBurmeseCajunCambodianCanadianCape VerdeanCarpatho RusynCelticCentral AmericanCentral American IndianCherokeeCheyenneChickasawChileanChineseChippewaChoctawColombianColvilleComancheCosta RicanCreeCreekCroatianCrowCubanCypriotCzechCzechoslovakianDanishDelawareDominicanDutchDutch West IndianEastern EuropeanEcuadorianEnglishEstonianEthiopianEuropeanFijianFilipinoFinnishFrenchFrench American IndianFrench CanadianGermanGerman RussianGhanaianGreekGuamanian/ChamorroGuatemalanGuyaneseHaitianHmongHonduranHopiHoumaHungarianIcelanderIndian (Asian)IndonesianInupiatIranianIraqiIrishIroquoisIsraeliItalianJamaicanJapaneseJordanianKenyanKiowaKoreanLaotianLatvianLebaneseLiberianLithuanianLumbeeLuxembourgerMacedonianMalaysianMalteseMarshalleseMenomineeMexicanMexican American IndianMongolianMoroccanNative HawaiianNavajoNepaleseNew ZealanderNicaraguanNigerianNorthern EuropeanNorwegianOkinawanOsageOttawaPaiutePakistaniPalestinianPanamanianParaguayanPennsylvania GermanPeruvianPimaPolishPortuguesePotawatomiPuebloPuerto RicanPuget Sound SalishRomanianRussianSalvadoranSamoanScandinavianScotch-IrishScottishSeminoleSenegaleseSerbianShoshoneSierra LeoneanSiouxSlavicSlovakSloveneSomaliSouth AfricanSouth AmericanSouth American IndianSoviet UnionSpaniardSpanishSpanish AmericanSpanish American IndianSri LankanSubsaharan AfricanSudaneseSwedishSwissSyrianTaiwaneseThaiTlingit-HaidaTohono O'OdhamTonganTrinidadian and TobagonianTsimshianTurkishU.S. Virgin IslanderUgandanUkrainianUruguayanUteVenezuelanVietnameseWelshWest IndianYakamaYaquiYugoslavianYumanYup'ikZimbabwean
Immigration
NonimmigrantsImmigrantsAfghanistanAfricaAlbaniaArgentinaArmeniaAsiaAustraliaAustriaBahamasBangladeshBarbadosBelarusBelgiumBelizeBoliviaBosnia and HerzegovinaBrazilBulgariaBurma/MyanmarCabo VerdeCambodiaCameroonCanadaCaribbeanCentral AmericaChileChinaColombiaCongoCosta RicaCroatiaCubaCzechoslovakiaDenmarkDominicaDominican RepublicEastern AfricaEastern AsiaEastern EuropeEcuadorEgyptEl SalvadorEnglandEritreaEthiopiaEuropeFijiFranceGermanyGhanaGreeceGrenadaGuatemalaGuyanaHaitiHondurasHong KongHungaryIndiaIndonesiaIranIraqIrelandIsraelItalyJamaicaJapanJordanKazakhstanKenyaKoreaKuwaitLaosLatin AmericaLatviaLebanonLiberiaLithuaniaMalaysiaMexicoMicronesiaMiddle AfricaMoldovaMoroccoNepalNetherlandsNicaraguaNigeriaNorth AmericaNorth MacedoniaNorthern AfricaNorthern EuropeNorwayOceaniaPakistanPanamaPeruPhilippinesPolandPortugalRomaniaRussiaSaudi ArabiaScotlandSenegalSerbiaSierra LeoneSingaporeSomaliaSouth AfricaSouth AmericaSouth Central AsiaSouth Eastern AsiaSouthern EuropeSpainSri LankaSt. Vincent and the GrenadinesSudanSwedenSwitzerlandSyriaTaiwanThailandTrinidad and TobagoTurkeyUgandaUkraineUruguayUzbekistanVenezuelaVietnamWest IndiesWestern AfricaWestern AsiaWestern EuropeYemenZaireZimbabweAzores
Family Households
Income
Poverty
Unemployment
Labor Participation
Family Structure
Vehicle Availability
Education Level
Disability

Family Households Comparison

Egyptians

Immigrants from Sweden

Exceptional
Tragic
65.4%
FAMILY HOUSEHOLDS
99.4/ 100
METRIC RATING
86th/ 347
METRIC RANK
62.5%
FAMILY HOUSEHOLDS
0.0/ 100
METRIC RATING
293rd/ 347
METRIC RANK

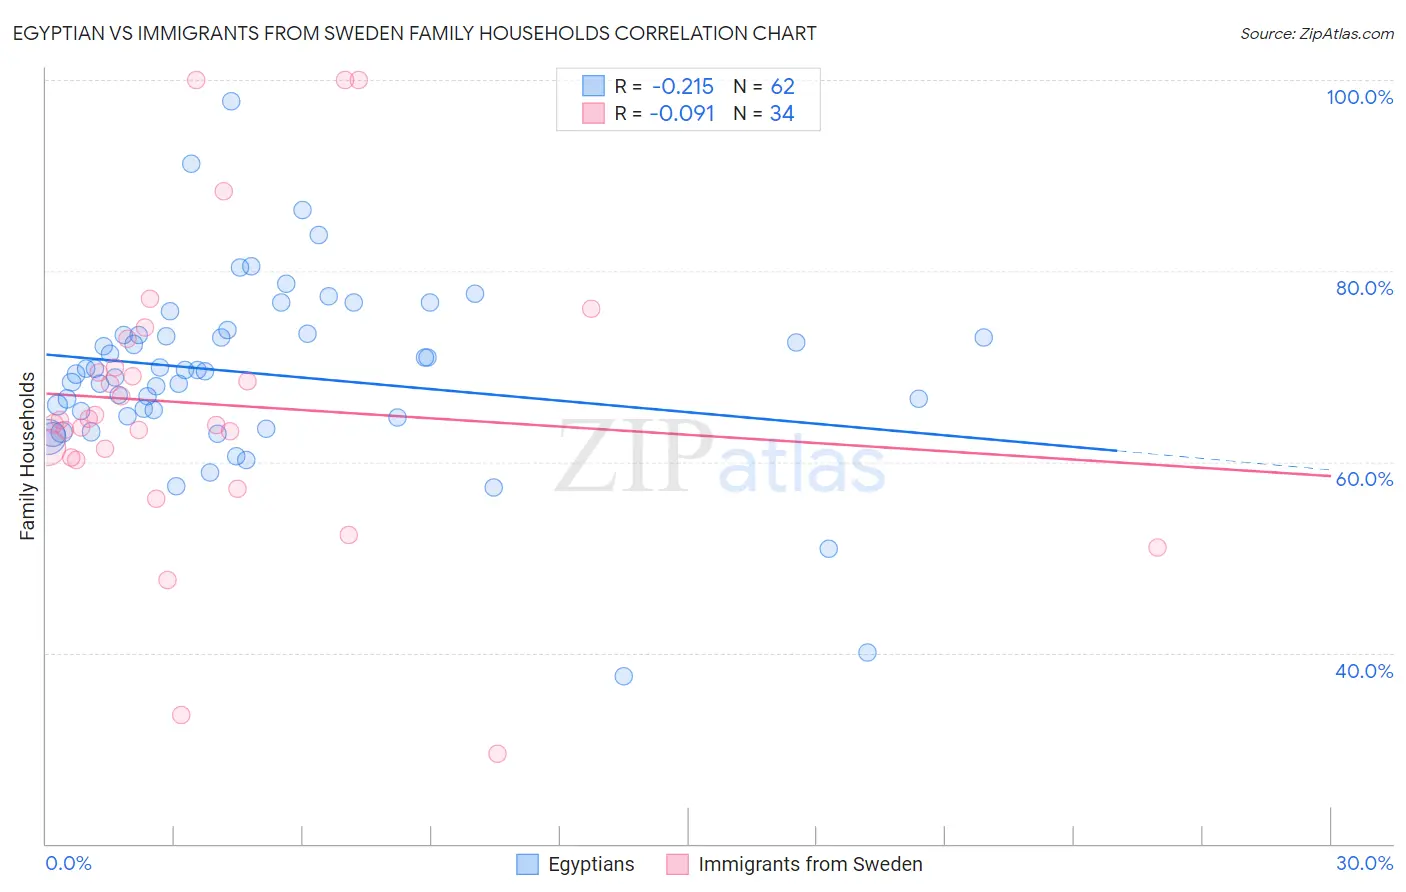
Egyptian vs Immigrants from Sweden Family Households Correlation Chart

The statistical analysis conducted on geographies consisting of 276,780,466 people shows a weak negative correlation between the proportion of Egyptians and percentage of family households in the United States with a correlation coefficient (R) of -0.215 and weighted average of 65.4%. Similarly, the statistical analysis conducted on geographies consisting of 164,705,416 people shows a slight negative correlation between the proportion of Immigrants from Sweden and percentage of family households in the United States with a correlation coefficient (R) of -0.091 and weighted average of 62.5%, a difference of 4.6%.
Egyptian vs Immigrants from Sweden Family Households

Family Households Correlation Summary

MeasurementEgyptianImmigrants from Sweden
Minimum37.6%29.4%
Maximum97.8%100.0%
Range60.2%70.6%
Mean69.2%66.1%
Median69.5%64.2%
Interquartile 25% (IQ1)64.8%60.5%
Interquartile 75% (IQ3)73.3%69.9%
Interquartile Range (IQR)8.6%9.4%
Standard Deviation (Sample)9.7%15.4%
Standard Deviation (Population)9.6%15.2%

Similar Demographics by Family Households

Demographics Similar to Egyptians by Family Households

In terms of family households, the demographic groups most similar to Egyptians are Immigrants from Cambodia (65.4%, a difference of 0.050%), Immigrants from Egypt (65.3%, a difference of 0.090%), Immigrants from Haiti (65.3%, a difference of 0.12%), Immigrants from Caribbean (65.3%, a difference of 0.13%), and Immigrants from Laos (65.3%, a difference of 0.14%).
DemographicsRating | RankFamily Households
Immigrants | Costa Rica
99.8
/100
|
#79
Exceptional
65.6%
Puget Sound Salish
99.8
/100
|
#80
Exceptional
65.6%
Jordanians
99.7
/100
|
#81
Exceptional
65.5%
Immigrants | Lebanon
99.7
/100
|
#82
Exceptional
65.5%
Immigrants | Guyana
99.6
/100
|
#83
Exceptional
65.5%
Americans
99.6
/100
|
#84
Exceptional
65.5%
Immigrants | Cambodia
99.5
/100
|
#85
Exceptional
65.4%
Egyptians
99.4
/100
|
#86
Exceptional
65.4%
Immigrants | Egypt
99.2
/100
|
#87
Exceptional
65.3%
Immigrants | Haiti
99.1
/100
|
#88
Exceptional
65.3%
Immigrants | Caribbean
99.1
/100
|
#89
Exceptional
65.3%
Immigrants | Laos
99.1
/100
|
#90
Exceptional
65.3%
Crow
98.9
/100
|
#91
Exceptional
65.3%
Hopi
98.8
/100
|
#92
Exceptional
65.3%
Guyanese
98.8
/100
|
#93
Exceptional
65.3%

Demographics Similar to Immigrants from Sweden by Family Households

In terms of family households, the demographic groups most similar to Immigrants from Sweden are Barbadian (62.5%, a difference of 0.060%), Okinawan (62.5%, a difference of 0.080%), Slovene (62.4%, a difference of 0.090%), French American Indian (62.4%, a difference of 0.10%), and Immigrants from Burma/Myanmar (62.6%, a difference of 0.13%).
DemographicsRating | RankFamily Households
British West Indians
0.1
/100
|
#286
Tragic
62.8%
Latvians
0.1
/100
|
#287
Tragic
62.8%
Immigrants | Uganda
0.1
/100
|
#288
Tragic
62.7%
Immigrants | Nepal
0.1
/100
|
#289
Tragic
62.7%
Immigrants | Grenada
0.0
/100
|
#290
Tragic
62.6%
U.S. Virgin Islanders
0.0
/100
|
#291
Tragic
62.6%
Immigrants | Burma/Myanmar
0.0
/100
|
#292
Tragic
62.6%
Immigrants | Sweden
0.0
/100
|
#293
Tragic
62.5%
Barbadians
0.0
/100
|
#294
Tragic
62.5%
Okinawans
0.0
/100
|
#295
Tragic
62.5%
Slovenes
0.0
/100
|
#296
Tragic
62.4%
French American Indians
0.0
/100
|
#297
Tragic
62.4%
Immigrants | Spain
0.0
/100
|
#298
Tragic
62.4%
Immigrants | Kuwait
0.0
/100
|
#299
Tragic
62.4%
Immigrants | Africa
0.0
/100
|
#300
Tragic
62.4%