Eastern European vs Dominican Average Family Size
COMPARE
Eastern European
Dominican
Average Family Size
Average Family Size Comparison
Eastern Europeans
Dominicans
3.12
AVERAGE FAMILY SIZE
0.1/ 100
METRIC RATING
318th/ 347
METRIC RANK
3.34
AVERAGE FAMILY SIZE
99.9/ 100
METRIC RATING
64th/ 347
METRIC RANK
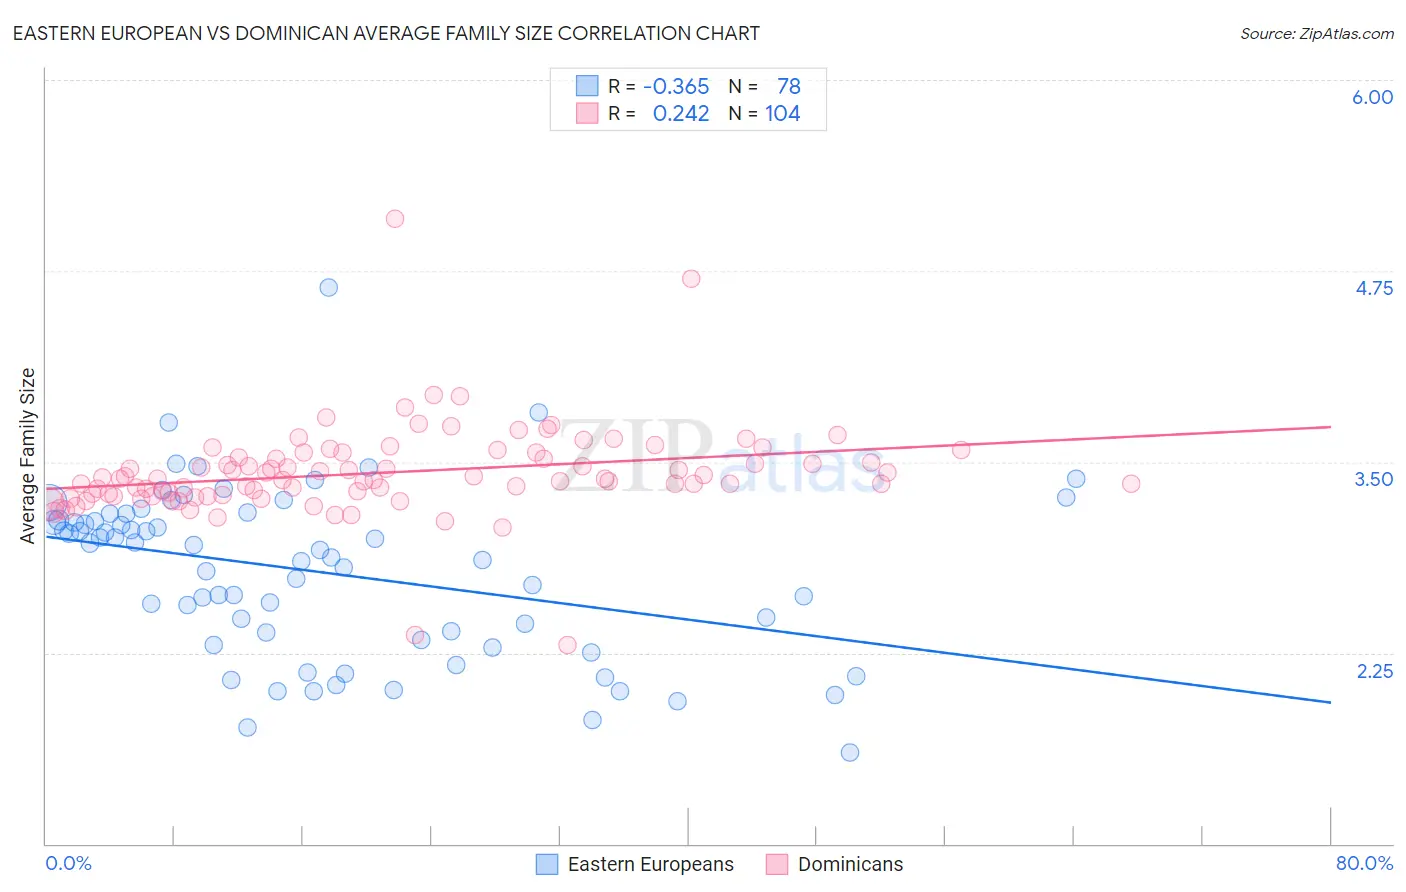
Eastern European vs Dominican Average Family Size Correlation Chart
The statistical analysis conducted on geographies consisting of 460,961,118 people shows a mild negative correlation between the proportion of Eastern Europeans and average family size in the United States with a correlation coefficient (R) of -0.365 and weighted average of 3.12. Similarly, the statistical analysis conducted on geographies consisting of 354,765,302 people shows a weak positive correlation between the proportion of Dominicans and average family size in the United States with a correlation coefficient (R) of 0.242 and weighted average of 3.34, a difference of 7.0%.
Average Family Size Correlation Summary
| Measurement | Eastern European | Dominican |
| Minimum | 1.60 | 2.30 |
| Maximum | 4.64 | 5.09 |
| Range | 3.04 | 2.79 |
| Mean | 2.78 | 3.43 |
| Median | 2.90 | 3.39 |
| Interquartile 25% (IQ1) | 2.33 | 3.29 |
| Interquartile 75% (IQ3) | 3.12 | 3.54 |
| Interquartile Range (IQR) | 0.79 | 0.26 |
| Standard Deviation (Sample) | 0.55 | 0.31 |
| Standard Deviation (Population) | 0.55 | 0.31 |
Similar Demographics by Average Family Size
Demographics Similar to Eastern Europeans by Average Family Size
In terms of average family size, the demographic groups most similar to Eastern Europeans are Welsh (3.12, a difference of 0.0%), Italian (3.12, a difference of 0.010%), Serbian (3.12, a difference of 0.070%), Immigrants from North America (3.12, a difference of 0.070%), and Immigrants from Austria (3.12, a difference of 0.10%).
| Demographics | Rating | Rank | Average Family Size |
| Immigrants | Northern Europe | 0.1 /100 | #311 | Tragic 3.13 |
| Immigrants | Australia | 0.1 /100 | #312 | Tragic 3.13 |
| Bulgarians | 0.1 /100 | #313 | Tragic 3.13 |
| Russians | 0.1 /100 | #314 | Tragic 3.12 |
| Immigrants | Scotland | 0.1 /100 | #315 | Tragic 3.12 |
| Serbians | 0.1 /100 | #316 | Tragic 3.12 |
| Italians | 0.1 /100 | #317 | Tragic 3.12 |
| Eastern Europeans | 0.1 /100 | #318 | Tragic 3.12 |
| Welsh | 0.1 /100 | #319 | Tragic 3.12 |
| Immigrants | North America | 0.0 /100 | #320 | Tragic 3.12 |
| Immigrants | Austria | 0.0 /100 | #321 | Tragic 3.12 |
| Immigrants | Canada | 0.0 /100 | #322 | Tragic 3.12 |
| Soviet Union | 0.0 /100 | #323 | Tragic 3.11 |
| Celtics | 0.0 /100 | #324 | Tragic 3.11 |
| English | 0.0 /100 | #325 | Tragic 3.11 |
Demographics Similar to Dominicans by Average Family Size
In terms of average family size, the demographic groups most similar to Dominicans are Immigrants from Laos (3.34, a difference of 0.020%), Chinese (3.34, a difference of 0.070%), Immigrants from St. Vincent and the Grenadines (3.34, a difference of 0.080%), Immigrants from Grenada (3.34, a difference of 0.090%), and Immigrants from Jamaica (3.33, a difference of 0.12%).
| Demographics | Rating | Rank | Average Family Size |
| Sri Lankans | 100.0 /100 | #57 | Exceptional 3.35 |
| Hondurans | 100.0 /100 | #58 | Exceptional 3.35 |
| Japanese | 100.0 /100 | #59 | Exceptional 3.35 |
| Immigrants | Armenia | 100.0 /100 | #60 | Exceptional 3.35 |
| Central American Indians | 100.0 /100 | #61 | Exceptional 3.35 |
| Immigrants | Grenada | 100.0 /100 | #62 | Exceptional 3.34 |
| Chinese | 100.0 /100 | #63 | Exceptional 3.34 |
| Dominicans | 99.9 /100 | #64 | Exceptional 3.34 |
| Immigrants | Laos | 99.9 /100 | #65 | Exceptional 3.34 |
| Immigrants | St. Vincent and the Grenadines | 99.9 /100 | #66 | Exceptional 3.34 |
| Immigrants | Jamaica | 99.9 /100 | #67 | Exceptional 3.33 |
| Immigrants | Cambodia | 99.9 /100 | #68 | Exceptional 3.33 |
| Immigrants | Immigrants | 99.9 /100 | #69 | Exceptional 3.33 |
| Immigrants | Trinidad and Tobago | 99.9 /100 | #70 | Exceptional 3.33 |
| Immigrants | West Indies | 99.9 /100 | #71 | Exceptional 3.33 |