Dutch West Indian vs Korean Family Households with Children
COMPARE
Dutch West Indian
Korean
Family Households with Children
Family Households with Children Comparison
Dutch West Indians
Koreans
27.2%
FAMILY HOUSEHOLDS WITH CHILDREN
15.8/ 100
METRIC RATING
209th/ 347
METRIC RANK
29.2%
FAMILY HOUSEHOLDS WITH CHILDREN
100.0/ 100
METRIC RATING
38th/ 347
METRIC RANK
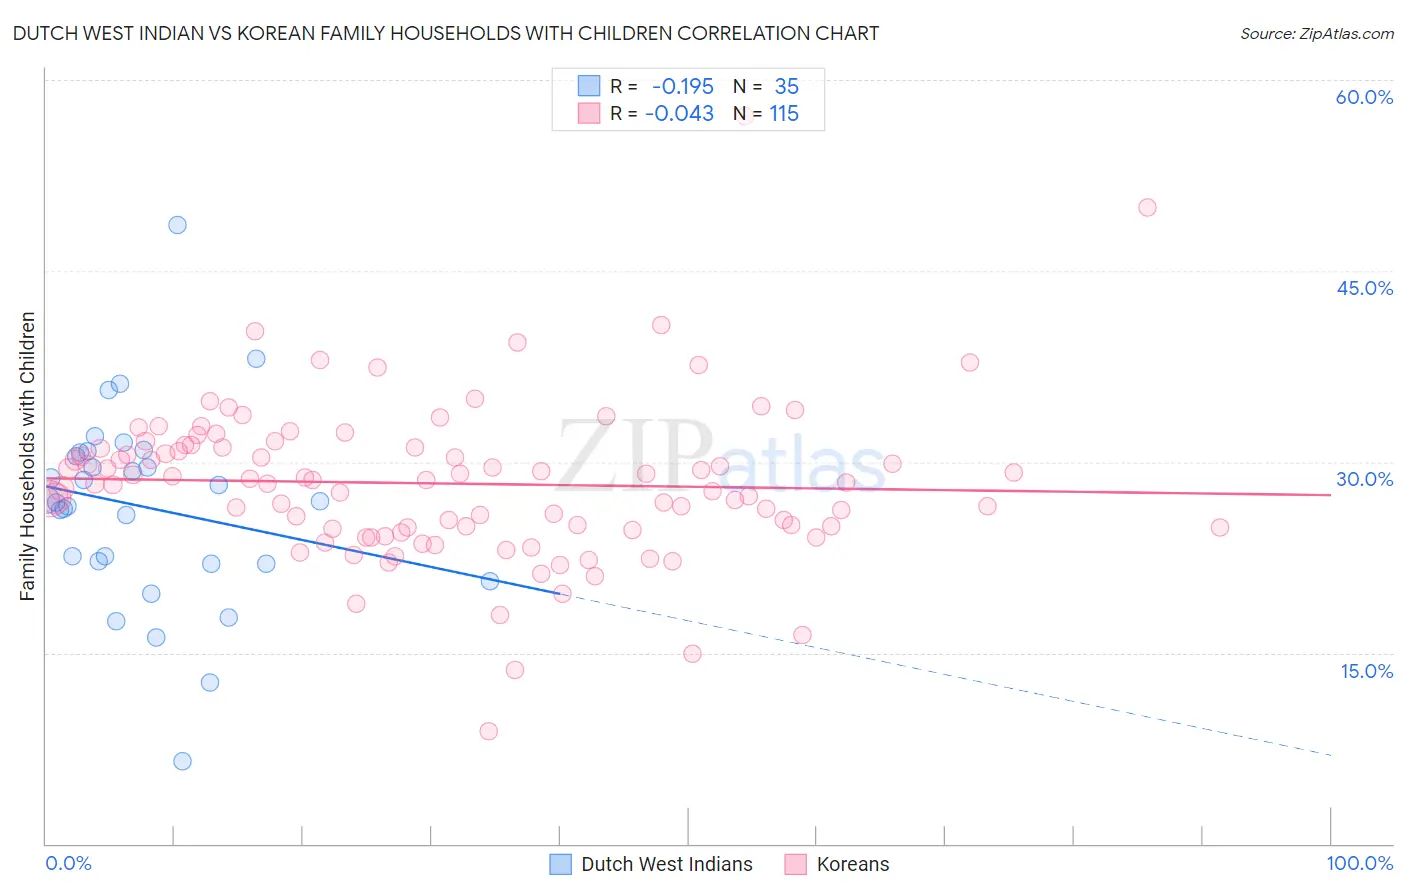
Dutch West Indian vs Korean Family Households with Children Correlation Chart
The statistical analysis conducted on geographies consisting of 85,765,288 people shows a poor negative correlation between the proportion of Dutch West Indians and percentage of family households with children in the United States with a correlation coefficient (R) of -0.195 and weighted average of 27.2%. Similarly, the statistical analysis conducted on geographies consisting of 510,137,043 people shows no correlation between the proportion of Koreans and percentage of family households with children in the United States with a correlation coefficient (R) of -0.043 and weighted average of 29.2%, a difference of 7.3%.
Family Households with Children Correlation Summary
| Measurement | Dutch West Indian | Korean |
| Minimum | 6.5% | 8.8% |
| Maximum | 48.6% | 57.1% |
| Range | 42.2% | 48.3% |
| Mean | 26.5% | 28.3% |
| Median | 26.9% | 28.4% |
| Interquartile 25% (IQ1) | 22.0% | 24.8% |
| Interquartile 75% (IQ3) | 30.8% | 31.1% |
| Interquartile Range (IQR) | 8.7% | 6.3% |
| Standard Deviation (Sample) | 7.7% | 6.3% |
| Standard Deviation (Population) | 7.5% | 6.3% |
Similar Demographics by Family Households with Children
Demographics Similar to Dutch West Indians by Family Households with Children
In terms of family households with children, the demographic groups most similar to Dutch West Indians are Immigrants from Poland (27.2%, a difference of 0.030%), Immigrants from Ukraine (27.2%, a difference of 0.060%), Welsh (27.2%, a difference of 0.070%), Immigrants from Dominica (27.2%, a difference of 0.080%), and Okinawan (27.2%, a difference of 0.090%).
| Demographics | Rating | Rank | Family Households with Children |
| Americans | 22.8 /100 | #202 | Fair 27.3% |
| Kiowa | 22.2 /100 | #203 | Fair 27.3% |
| Immigrants | Sudan | 21.6 /100 | #204 | Fair 27.3% |
| Immigrants | Haiti | 20.3 /100 | #205 | Fair 27.2% |
| Immigrants | Micronesia | 20.2 /100 | #206 | Fair 27.2% |
| Haitians | 19.8 /100 | #207 | Poor 27.2% |
| Immigrants | Poland | 16.4 /100 | #208 | Poor 27.2% |
| Dutch West Indians | 15.8 /100 | #209 | Poor 27.2% |
| Immigrants | Ukraine | 14.4 /100 | #210 | Poor 27.2% |
| Welsh | 14.2 /100 | #211 | Poor 27.2% |
| Immigrants | Dominica | 13.9 /100 | #212 | Poor 27.2% |
| Okinawans | 13.7 /100 | #213 | Poor 27.2% |
| Africans | 13.0 /100 | #214 | Poor 27.2% |
| Northern Europeans | 12.8 /100 | #215 | Poor 27.2% |
| Cubans | 12.2 /100 | #216 | Poor 27.1% |
Demographics Similar to Koreans by Family Households with Children
In terms of family households with children, the demographic groups most similar to Koreans are Immigrants from Cameroon (29.2%, a difference of 0.14%), Yaqui (29.1%, a difference of 0.15%), Central American (29.1%, a difference of 0.16%), Immigrants from South Eastern Asia (29.1%, a difference of 0.25%), and Spanish American Indian (29.1%, a difference of 0.26%).
| Demographics | Rating | Rank | Family Households with Children |
| Japanese | 100.0 /100 | #31 | Exceptional 29.4% |
| Immigrants | Yemen | 100.0 /100 | #32 | Exceptional 29.4% |
| Venezuelans | 100.0 /100 | #33 | Exceptional 29.4% |
| Immigrants | Bolivia | 100.0 /100 | #34 | Exceptional 29.3% |
| Immigrants | Sierra Leone | 100.0 /100 | #35 | Exceptional 29.3% |
| Immigrants | Venezuela | 100.0 /100 | #36 | Exceptional 29.3% |
| Immigrants | Cameroon | 100.0 /100 | #37 | Exceptional 29.2% |
| Koreans | 100.0 /100 | #38 | Exceptional 29.2% |
| Yaqui | 100.0 /100 | #39 | Exceptional 29.1% |
| Central Americans | 100.0 /100 | #40 | Exceptional 29.1% |
| Immigrants | South Eastern Asia | 100.0 /100 | #41 | Exceptional 29.1% |
| Spanish American Indians | 100.0 /100 | #42 | Exceptional 29.1% |
| Asians | 100.0 /100 | #43 | Exceptional 29.1% |
| Immigrants | Taiwan | 100.0 /100 | #44 | Exceptional 29.0% |
| Fijians | 100.0 /100 | #45 | Exceptional 29.0% |