Dutch vs Immigrants from Ecuador Single Mother Households
COMPARE
Dutch
Immigrants from Ecuador
Single Mother Households
Single Mother Households Comparison
Dutch
Immigrants from Ecuador
5.8%
SINGLE MOTHER HOUSEHOLDS
95.1/ 100
METRIC RATING
114th/ 347
METRIC RANK
7.3%
SINGLE MOTHER HOUSEHOLDS
0.3/ 100
METRIC RATING
254th/ 347
METRIC RANK
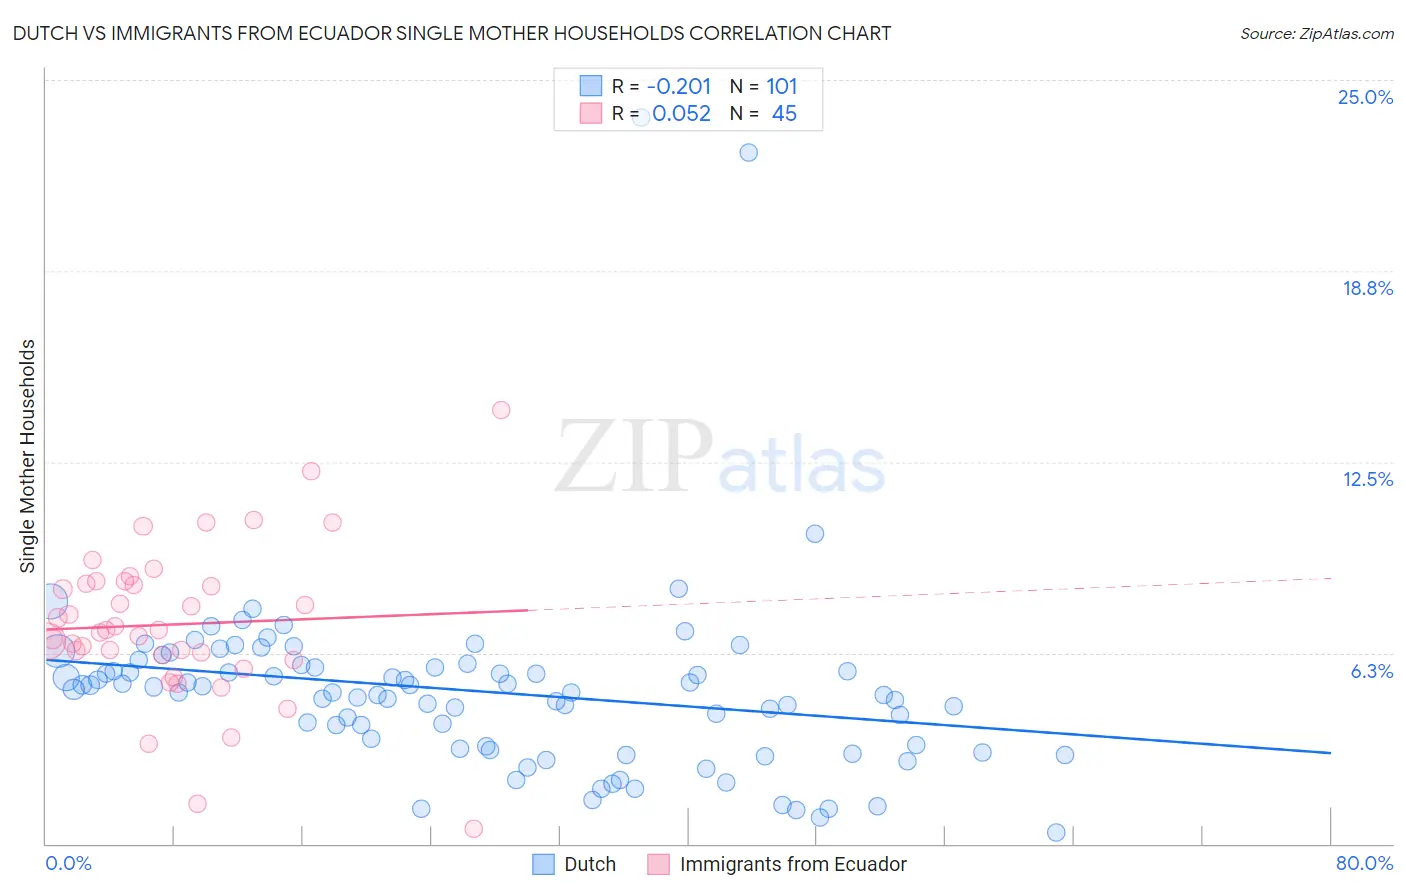
Dutch vs Immigrants from Ecuador Single Mother Households Correlation Chart
The statistical analysis conducted on geographies consisting of 549,817,585 people shows a weak negative correlation between the proportion of Dutch and percentage of single mother households in the United States with a correlation coefficient (R) of -0.201 and weighted average of 5.8%. Similarly, the statistical analysis conducted on geographies consisting of 270,615,585 people shows a slight positive correlation between the proportion of Immigrants from Ecuador and percentage of single mother households in the United States with a correlation coefficient (R) of 0.052 and weighted average of 7.3%, a difference of 26.6%.
Single Mother Households Correlation Summary
| Measurement | Dutch | Immigrants from Ecuador |
| Minimum | 0.36% | 0.47% |
| Maximum | 23.8% | 14.2% |
| Range | 23.4% | 13.7% |
| Mean | 5.0% | 7.2% |
| Median | 5.0% | 7.0% |
| Interquartile 25% (IQ1) | 3.1% | 6.1% |
| Interquartile 75% (IQ3) | 5.8% | 8.5% |
| Interquartile Range (IQR) | 2.7% | 2.5% |
| Standard Deviation (Sample) | 3.2% | 2.5% |
| Standard Deviation (Population) | 3.2% | 2.5% |
Similar Demographics by Single Mother Households
Demographics Similar to Dutch by Single Mother Households
In terms of single mother households, the demographic groups most similar to Dutch are Mongolian (5.8%, a difference of 0.13%), Irish (5.8%, a difference of 0.19%), Immigrants from Kuwait (5.8%, a difference of 0.20%), Immigrants from England (5.8%, a difference of 0.24%), and Pennsylvania German (5.8%, a difference of 0.25%).
| Demographics | Rating | Rank | Single Mother Households |
| Paraguayans | 95.8 /100 | #107 | Exceptional 5.8% |
| Immigrants | Italy | 95.8 /100 | #108 | Exceptional 5.8% |
| Immigrants | Western Europe | 95.7 /100 | #109 | Exceptional 5.8% |
| British | 95.5 /100 | #110 | Exceptional 5.8% |
| Immigrants | England | 95.5 /100 | #111 | Exceptional 5.8% |
| Immigrants | Kuwait | 95.4 /100 | #112 | Exceptional 5.8% |
| Mongolians | 95.3 /100 | #113 | Exceptional 5.8% |
| Dutch | 95.1 /100 | #114 | Exceptional 5.8% |
| Irish | 94.8 /100 | #115 | Exceptional 5.8% |
| Pennsylvania Germans | 94.7 /100 | #116 | Exceptional 5.8% |
| Bolivians | 94.6 /100 | #117 | Exceptional 5.8% |
| Laotians | 94.3 /100 | #118 | Exceptional 5.8% |
| South Africans | 94.1 /100 | #119 | Exceptional 5.8% |
| Tongans | 93.7 /100 | #120 | Exceptional 5.8% |
| Argentineans | 93.7 /100 | #121 | Exceptional 5.8% |
Demographics Similar to Immigrants from Ecuador by Single Mother Households
In terms of single mother households, the demographic groups most similar to Immigrants from Ecuador are Cajun (7.3%, a difference of 0.050%), Mexican American Indian (7.4%, a difference of 0.37%), Alaskan Athabascan (7.3%, a difference of 0.44%), Malaysian (7.3%, a difference of 0.46%), and Seminole (7.4%, a difference of 0.73%).
| Demographics | Rating | Rank | Single Mother Households |
| Dutch West Indians | 0.4 /100 | #247 | Tragic 7.3% |
| Spanish American Indians | 0.4 /100 | #248 | Tragic 7.3% |
| Bermudans | 0.4 /100 | #249 | Tragic 7.3% |
| Immigrants | Africa | 0.4 /100 | #250 | Tragic 7.3% |
| Malaysians | 0.3 /100 | #251 | Tragic 7.3% |
| Alaskan Athabascans | 0.3 /100 | #252 | Tragic 7.3% |
| Cajuns | 0.3 /100 | #253 | Tragic 7.3% |
| Immigrants | Ecuador | 0.3 /100 | #254 | Tragic 7.3% |
| Mexican American Indians | 0.2 /100 | #255 | Tragic 7.4% |
| Seminole | 0.2 /100 | #256 | Tragic 7.4% |
| Alaska Natives | 0.2 /100 | #257 | Tragic 7.4% |
| Pueblo | 0.2 /100 | #258 | Tragic 7.4% |
| Immigrants | Yemen | 0.2 /100 | #259 | Tragic 7.4% |
| Immigrants | Zaire | 0.2 /100 | #260 | Tragic 7.4% |
| Japanese | 0.2 /100 | #261 | Tragic 7.4% |