Delaware vs Trinidadian and Tobagonian Currently Married

COMPARE

Delaware
Race
Ancestry
AfghanAfricanAlaska NativeAlaskan AthabascanAlbanianAleutAlsatianAmericanApacheArabArapahoArgentineanArmenianAssyrian/Chaldean/SyriacAustralianAustrianBahamianBangladeshiBarbadianBasqueBelgianBelizeanBermudanBhutaneseBlackfeetBolivianBrazilianBritishBritish West IndianBulgarianBurmeseCajunCambodianCanadianCape VerdeanCarpatho RusynCelticCentral AmericanCentral American IndianCherokeeCheyenneChickasawChileanChineseChippewaChoctawColombianColvilleComancheCosta RicanCreeCreekCroatianCrowCubanCypriotCzechCzechoslovakianDanishDelawareDominicanDutchDutch West IndianEastern EuropeanEcuadorianEgyptianEnglishEstonianEthiopianEuropeanFijianFilipinoFinnishFrenchFrench American IndianFrench CanadianGermanGerman RussianGhanaianGreekGuamanian/ChamorroGuatemalanGuyaneseHaitianHmongHonduranHopiHoumaHungarianIcelanderIndian (Asian)IndonesianInupiatIranianIraqiIrishIroquoisIsraeliItalianJamaicanJapaneseJordanianKenyanKiowaKoreanLaotianLatvianLebaneseLiberianLithuanianLumbeeLuxembourgerMacedonianMalaysianMalteseMarshalleseMenomineeMexicanMexican American IndianMongolianMoroccanNative HawaiianNavajoNepaleseNew ZealanderNicaraguanNigerianNorthern EuropeanNorwegianOkinawanOsageOttawaPaiutePakistaniPalestinianPanamanianParaguayanPennsylvania GermanPeruvianPimaPolishPortuguesePotawatomiPuebloPuerto RicanPuget Sound SalishRomanianRussianSalvadoranSamoanScandinavianScotch-IrishScottishSeminoleSenegaleseSerbianShoshoneSierra LeoneanSiouxSlavicSlovakSloveneSomaliSouth AfricanSouth AmericanSouth American IndianSoviet UnionSpaniardSpanishSpanish AmericanSpanish American IndianSri LankanSubsaharan AfricanSudaneseSwedishSwissSyrianTaiwaneseThaiTlingit-HaidaTohono O'OdhamTonganTsimshianTurkishU.S. Virgin IslanderUgandanUkrainianUruguayanUteVenezuelanVietnameseWelshWest IndianYakamaYaquiYugoslavianYumanYup'ikZimbabwean
Immigration
NonimmigrantsImmigrantsAfghanistanAfricaAlbaniaArgentinaArmeniaAsiaAustraliaAustriaBahamasBangladeshBarbadosBelarusBelgiumBelizeBoliviaBosnia and HerzegovinaBrazilBulgariaBurma/MyanmarCabo VerdeCambodiaCameroonCanadaCaribbeanCentral AmericaChileChinaColombiaCongoCosta RicaCroatiaCubaCzechoslovakiaDenmarkDominicaDominican RepublicEastern AfricaEastern AsiaEastern EuropeEcuadorEgyptEl SalvadorEnglandEritreaEthiopiaEuropeFijiFranceGermanyGhanaGreeceGrenadaGuatemalaGuyanaHaitiHondurasHong KongHungaryIndiaIndonesiaIranIraqIrelandIsraelItalyJamaicaJapanJordanKazakhstanKenyaKoreaKuwaitLaosLatin AmericaLatviaLebanonLiberiaLithuaniaMalaysiaMexicoMicronesiaMiddle AfricaMoldovaMoroccoNepalNetherlandsNicaraguaNigeriaNorth AmericaNorth MacedoniaNorthern AfricaNorthern EuropeNorwayOceaniaPakistanPanamaPeruPhilippinesPolandPortugalRomaniaRussiaSaudi ArabiaScotlandSenegalSerbiaSierra LeoneSingaporeSomaliaSouth AfricaSouth AmericaSouth Central AsiaSouth Eastern AsiaSouthern EuropeSpainSri LankaSt. Vincent and the GrenadinesSudanSwedenSwitzerlandSyriaTaiwanThailandTrinidad and TobagoTurkeyUgandaUkraineUruguayUzbekistanVenezuelaVietnamWest IndiesWestern AfricaWestern AsiaWestern EuropeYemenZaireZimbabweAzores
Trinidadian and Tobagonian
Race
Ancestry
AfghanAfricanAlaska NativeAlaskan AthabascanAlbanianAleutAlsatianAmericanApacheArabArapahoArgentineanArmenianAssyrian/Chaldean/SyriacAustralianAustrianBahamianBangladeshiBarbadianBasqueBelgianBelizeanBermudanBhutaneseBlackfeetBolivianBrazilianBritishBritish West IndianBulgarianBurmeseCajunCambodianCanadianCape VerdeanCarpatho RusynCelticCentral AmericanCentral American IndianCherokeeCheyenneChickasawChileanChineseChippewaChoctawColombianColvilleComancheCosta RicanCreeCreekCroatianCrowCubanCypriotCzechCzechoslovakianDanishDominicanDutchDutch West IndianEastern EuropeanEcuadorianEgyptianEnglishEstonianEthiopianEuropeanFijianFilipinoFinnishFrenchFrench American IndianFrench CanadianGermanGerman RussianGhanaianGreekGuamanian/ChamorroGuatemalanGuyaneseHaitianHmongHonduranHopiHoumaHungarianIcelanderIndian (Asian)IndonesianInupiatIranianIraqiIrishIroquoisIsraeliItalianJamaicanJapaneseJordanianKenyanKiowaKoreanLaotianLatvianLebaneseLiberianLithuanianLumbeeLuxembourgerMacedonianMalaysianMalteseMarshalleseMenomineeMexicanMexican American IndianMongolianMoroccanNative HawaiianNavajoNepaleseNew ZealanderNicaraguanNigerianNorthern EuropeanNorwegianOkinawanOsageOttawaPaiutePakistaniPalestinianPanamanianParaguayanPennsylvania GermanPeruvianPimaPolishPortuguesePotawatomiPuebloPuerto RicanPuget Sound SalishRomanianRussianSalvadoranSamoanScandinavianScotch-IrishScottishSeminoleSenegaleseSerbianShoshoneSierra LeoneanSiouxSlavicSlovakSloveneSomaliSouth AfricanSouth AmericanSouth American IndianSoviet UnionSpaniardSpanishSpanish AmericanSpanish American IndianSri LankanSubsaharan AfricanSudaneseSwedishSwissSyrianTaiwaneseThaiTlingit-HaidaTohono O'OdhamTonganTrinidadian and TobagonianTsimshianTurkishU.S. Virgin IslanderUgandanUkrainianUruguayanUteVenezuelanVietnameseWelshWest IndianYakamaYaquiYugoslavianYumanYup'ikZimbabwean
Immigration
NonimmigrantsImmigrantsAfghanistanAfricaAlbaniaArgentinaArmeniaAsiaAustraliaAustriaBahamasBangladeshBarbadosBelarusBelgiumBelizeBoliviaBosnia and HerzegovinaBrazilBulgariaBurma/MyanmarCabo VerdeCambodiaCameroonCanadaCaribbeanCentral AmericaChileChinaColombiaCongoCosta RicaCroatiaCubaCzechoslovakiaDenmarkDominicaDominican RepublicEastern AfricaEastern AsiaEastern EuropeEcuadorEgyptEl SalvadorEnglandEritreaEthiopiaEuropeFijiFranceGermanyGhanaGreeceGrenadaGuatemalaGuyanaHaitiHondurasHong KongHungaryIndiaIndonesiaIranIraqIrelandIsraelItalyJamaicaJapanJordanKazakhstanKenyaKoreaKuwaitLaosLatin AmericaLatviaLebanonLiberiaLithuaniaMalaysiaMexicoMicronesiaMiddle AfricaMoldovaMoroccoNepalNetherlandsNicaraguaNigeriaNorth AmericaNorth MacedoniaNorthern AfricaNorthern EuropeNorwayOceaniaPakistanPanamaPeruPhilippinesPolandPortugalRomaniaRussiaSaudi ArabiaScotlandSenegalSerbiaSierra LeoneSingaporeSomaliaSouth AfricaSouth AmericaSouth Central AsiaSouth Eastern AsiaSouthern EuropeSpainSri LankaSt. Vincent and the GrenadinesSudanSwedenSwitzerlandSyriaTaiwanThailandTrinidad and TobagoTurkeyUgandaUkraineUruguayUzbekistanVenezuelaVietnamWest IndiesWestern AfricaWestern AsiaWestern EuropeYemenZaireZimbabweAzores
Currently Married
Income
Poverty
Unemployment
Labor Participation
Family Structure
Vehicle Availability
Education Level
Disability

Currently Married Comparison

Delaware

Trinidadians and Tobagonians

Good
Tragic
46.9%
CURRENTLY MARRIED
64.7/ 100
METRIC RATING
163rd/ 347
METRIC RANK
41.5%
CURRENTLY MARRIED
0.0/ 100
METRIC RATING
311th/ 347
METRIC RANK

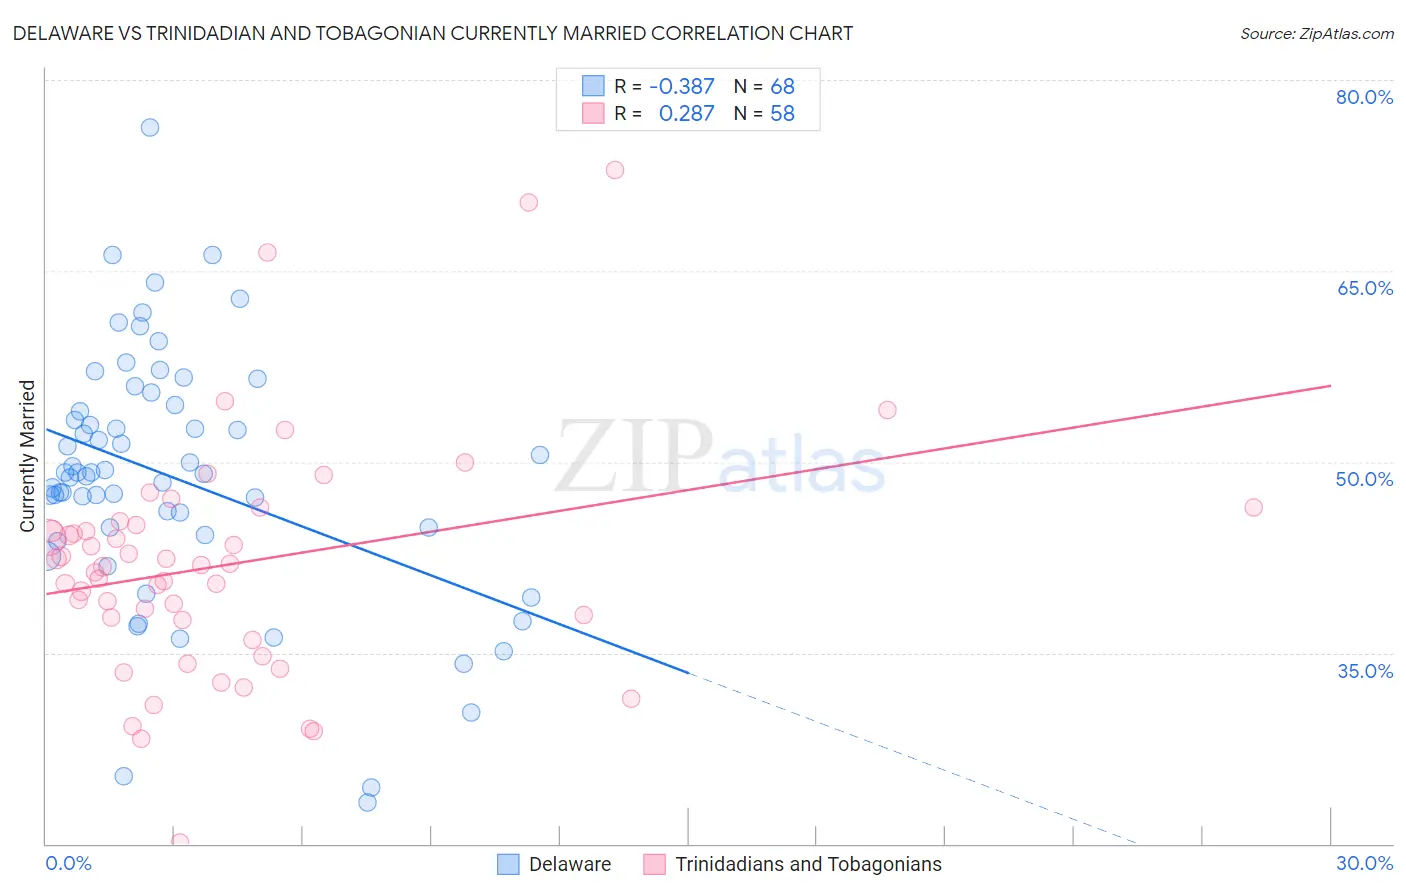
Delaware vs Trinidadian and Tobagonian Currently Married Correlation Chart

The statistical analysis conducted on geographies consisting of 96,237,198 people shows a mild negative correlation between the proportion of Delaware and percentage of population currently married in the United States with a correlation coefficient (R) of -0.387 and weighted average of 46.9%. Similarly, the statistical analysis conducted on geographies consisting of 219,846,005 people shows a weak positive correlation between the proportion of Trinidadians and Tobagonians and percentage of population currently married in the United States with a correlation coefficient (R) of 0.287 and weighted average of 41.5%, a difference of 12.9%.
Delaware vs Trinidadian and Tobagonian Currently Married

Currently Married Correlation Summary

MeasurementDelawareTrinidadian and Tobagonian
Minimum23.2%20.1%
Maximum76.3%72.9%
Range53.1%52.8%
Mean48.7%41.9%
Median49.1%41.8%
Interquartile 25% (IQ1)44.5%37.6%
Interquartile 75% (IQ3)54.2%45.0%
Interquartile Range (IQR)9.7%7.5%
Standard Deviation (Sample)9.9%9.4%
Standard Deviation (Population)9.9%9.4%

Similar Demographics by Currently Married

Demographics Similar to Delaware by Currently Married

In terms of currently married, the demographic groups most similar to Delaware are Immigrants from Western Asia (46.9%, a difference of 0.020%), Nonimmigrants (46.9%, a difference of 0.030%), Immigrants from Uzbekistan (46.9%, a difference of 0.050%), Immigrants from Southern Europe (46.9%, a difference of 0.050%), and Iraqi (46.9%, a difference of 0.070%).
DemographicsRating | RankCurrently Married
Spanish
68.1
/100
|
#156
Good
47.0%
Immigrants | Switzerland
67.8
/100
|
#157
Good
46.9%
Cherokee
66.8
/100
|
#158
Good
46.9%
Iraqis
66.4
/100
|
#159
Good
46.9%
Immigrants | Uzbekistan
66.0
/100
|
#160
Good
46.9%
Immigrants | Southern Europe
65.9
/100
|
#161
Good
46.9%
Immigrants | Nonimmigrants
65.4
/100
|
#162
Good
46.9%
Delaware
64.7
/100
|
#163
Good
46.9%
Immigrants | Western Asia
64.2
/100
|
#164
Good
46.9%
Samoans
59.8
/100
|
#165
Average
46.8%
Immigrants | Syria
59.3
/100
|
#166
Average
46.8%
Spaniards
58.8
/100
|
#167
Average
46.8%
Immigrants | Afghanistan
58.2
/100
|
#168
Average
46.8%
Armenians
58.2
/100
|
#169
Average
46.8%
Immigrants | Latvia
56.7
/100
|
#170
Average
46.7%

Demographics Similar to Trinidadians and Tobagonians by Currently Married

In terms of currently married, the demographic groups most similar to Trinidadians and Tobagonians are Guyanese (41.6%, a difference of 0.15%), Somali (41.5%, a difference of 0.18%), Jamaican (41.4%, a difference of 0.47%), Immigrants from Liberia (41.8%, a difference of 0.51%), and West Indian (41.3%, a difference of 0.55%).
DemographicsRating | RankCurrently Married
Immigrants | Bahamas
0.0
/100
|
#304
Tragic
41.9%
Immigrants | Trinidad and Tobago
0.0
/100
|
#305
Tragic
41.9%
Immigrants | Guyana
0.0
/100
|
#306
Tragic
41.9%
Africans
0.0
/100
|
#307
Tragic
41.8%
Immigrants | Belize
0.0
/100
|
#308
Tragic
41.8%
Immigrants | Liberia
0.0
/100
|
#309
Tragic
41.8%
Guyanese
0.0
/100
|
#310
Tragic
41.6%
Trinidadians and Tobagonians
0.0
/100
|
#311
Tragic
41.5%
Somalis
0.0
/100
|
#312
Tragic
41.5%
Jamaicans
0.0
/100
|
#313
Tragic
41.4%
West Indians
0.0
/100
|
#314
Tragic
41.3%
Inupiat
0.0
/100
|
#315
Tragic
41.3%
Immigrants | Caribbean
0.0
/100
|
#316
Tragic
41.3%
Haitians
0.0
/100
|
#317
Tragic
41.3%
Bahamians
0.0
/100
|
#318
Tragic
41.2%