Delaware vs Jordanian Single Father Households
COMPARE
Delaware
Jordanian
Single Father Households
Single Father Households Comparison
Delaware
Jordanians
2.5%
SINGLE FATHER HOUSEHOLDS
2.5/ 100
METRIC RATING
247th/ 347
METRIC RANK
2.2%
SINGLE FATHER HOUSEHOLDS
96.9/ 100
METRIC RATING
127th/ 347
METRIC RANK
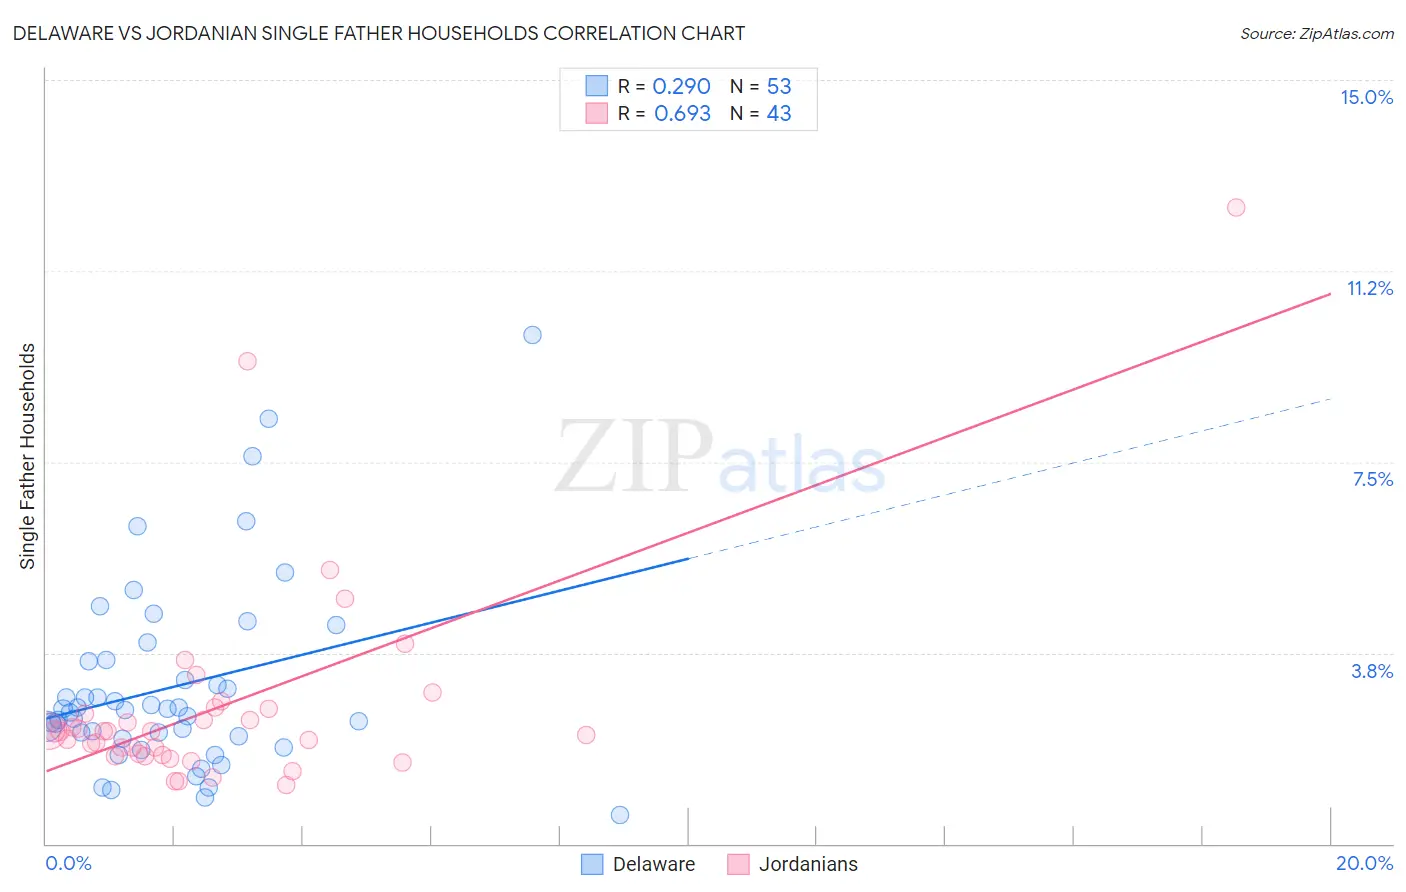
Delaware vs Jordanian Single Father Households Correlation Chart
The statistical analysis conducted on geographies consisting of 95,939,857 people shows a weak positive correlation between the proportion of Delaware and percentage of single father households in the United States with a correlation coefficient (R) of 0.290 and weighted average of 2.5%. Similarly, the statistical analysis conducted on geographies consisting of 165,930,664 people shows a significant positive correlation between the proportion of Jordanians and percentage of single father households in the United States with a correlation coefficient (R) of 0.693 and weighted average of 2.2%, a difference of 14.0%.
Single Father Households Correlation Summary
| Measurement | Delaware | Jordanian |
| Minimum | 0.57% | 1.1% |
| Maximum | 10.0% | 12.5% |
| Range | 9.4% | 11.4% |
| Mean | 3.1% | 2.7% |
| Median | 2.6% | 2.2% |
| Interquartile 25% (IQ1) | 2.1% | 1.7% |
| Interquartile 75% (IQ3) | 3.6% | 2.6% |
| Interquartile Range (IQR) | 1.5% | 0.89% |
| Standard Deviation (Sample) | 1.9% | 2.1% |
| Standard Deviation (Population) | 1.9% | 2.0% |
Similar Demographics by Single Father Households
Demographics Similar to Delaware by Single Father Households
In terms of single father households, the demographic groups most similar to Delaware are Native Hawaiian (2.5%, a difference of 0.020%), Basque (2.5%, a difference of 0.030%), Bahamian (2.5%, a difference of 0.040%), Immigrants from Cameroon (2.5%, a difference of 0.13%), and Immigrants from Middle Africa (2.5%, a difference of 0.24%).
| Demographics | Rating | Rank | Single Father Households |
| Immigrants | Dominica | 4.8 /100 | #240 | Tragic 2.5% |
| Portuguese | 4.1 /100 | #241 | Tragic 2.5% |
| Osage | 4.1 /100 | #242 | Tragic 2.5% |
| Spaniards | 3.1 /100 | #243 | Tragic 2.5% |
| Immigrants | Middle Africa | 2.8 /100 | #244 | Tragic 2.5% |
| Basques | 2.5 /100 | #245 | Tragic 2.5% |
| Native Hawaiians | 2.5 /100 | #246 | Tragic 2.5% |
| Delaware | 2.5 /100 | #247 | Tragic 2.5% |
| Bahamians | 2.4 /100 | #248 | Tragic 2.5% |
| Immigrants | Cameroon | 2.3 /100 | #249 | Tragic 2.5% |
| Somalis | 2.1 /100 | #250 | Tragic 2.5% |
| Liberians | 2.0 /100 | #251 | Tragic 2.5% |
| Immigrants | Eritrea | 2.0 /100 | #252 | Tragic 2.5% |
| Immigrants | Somalia | 1.9 /100 | #253 | Tragic 2.5% |
| Immigrants | Thailand | 1.8 /100 | #254 | Tragic 2.5% |
Demographics Similar to Jordanians by Single Father Households
In terms of single father households, the demographic groups most similar to Jordanians are Moroccan (2.2%, a difference of 0.0%), Immigrants from England (2.2%, a difference of 0.040%), Serbian (2.2%, a difference of 0.050%), Immigrants from Chile (2.2%, a difference of 0.17%), and Immigrants from Jordan (2.2%, a difference of 0.23%).
| Demographics | Rating | Rank | Single Father Households |
| Australians | 97.7 /100 | #120 | Exceptional 2.2% |
| Immigrants | Brazil | 97.7 /100 | #121 | Exceptional 2.2% |
| Immigrants | Iraq | 97.6 /100 | #122 | Exceptional 2.2% |
| Immigrants | Yemen | 97.5 /100 | #123 | Exceptional 2.2% |
| British West Indians | 97.4 /100 | #124 | Exceptional 2.2% |
| Immigrants | Indonesia | 97.4 /100 | #125 | Exceptional 2.2% |
| Moroccans | 96.9 /100 | #126 | Exceptional 2.2% |
| Jordanians | 96.9 /100 | #127 | Exceptional 2.2% |
| Immigrants | England | 96.8 /100 | #128 | Exceptional 2.2% |
| Serbians | 96.8 /100 | #129 | Exceptional 2.2% |
| Immigrants | Chile | 96.7 /100 | #130 | Exceptional 2.2% |
| Immigrants | Jordan | 96.6 /100 | #131 | Exceptional 2.2% |
| Poles | 96.5 /100 | #132 | Exceptional 2.2% |
| Taiwanese | 96.3 /100 | #133 | Exceptional 2.2% |
| Zimbabweans | 95.1 /100 | #134 | Exceptional 2.2% |