Danish vs Immigrants from Zaire Average Family Size
COMPARE
Danish
Immigrants from Zaire
Average Family Size
Average Family Size Comparison
Danes
Immigrants from Zaire
3.17
AVERAGE FAMILY SIZE
2.5/ 100
METRIC RATING
246th/ 347
METRIC RANK
3.22
AVERAGE FAMILY SIZE
30.5/ 100
METRIC RATING
191st/ 347
METRIC RANK
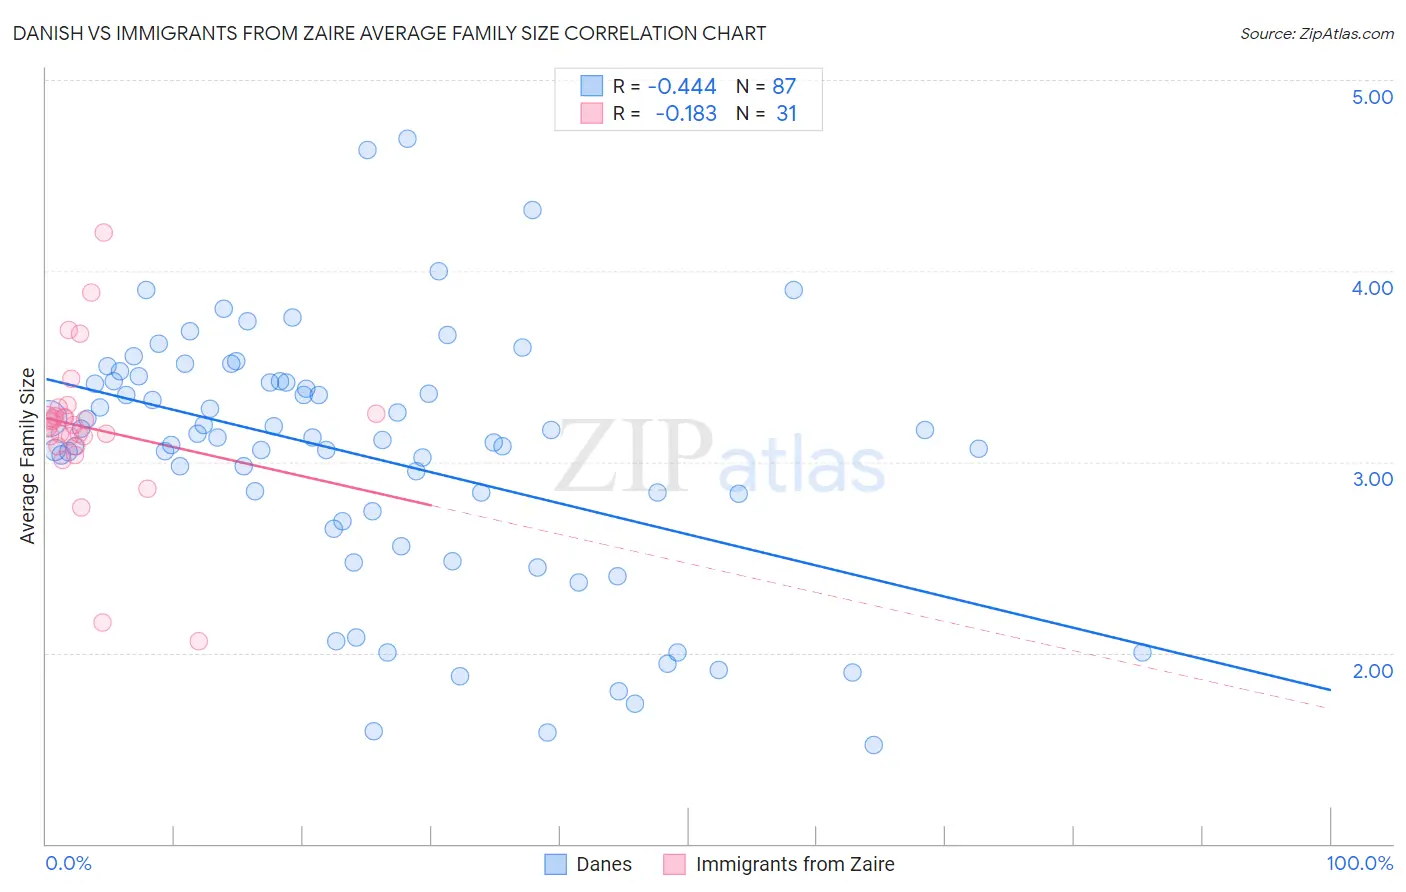
Danish vs Immigrants from Zaire Average Family Size Correlation Chart
The statistical analysis conducted on geographies consisting of 473,910,461 people shows a moderate negative correlation between the proportion of Danes and average family size in the United States with a correlation coefficient (R) of -0.444 and weighted average of 3.17. Similarly, the statistical analysis conducted on geographies consisting of 107,246,225 people shows a poor negative correlation between the proportion of Immigrants from Zaire and average family size in the United States with a correlation coefficient (R) of -0.183 and weighted average of 3.22, a difference of 1.3%.
Average Family Size Correlation Summary
| Measurement | Danish | Immigrants from Zaire |
| Minimum | 1.52 | 2.06 |
| Maximum | 4.69 | 4.20 |
| Range | 3.17 | 2.14 |
| Mean | 3.03 | 3.18 |
| Median | 3.12 | 3.19 |
| Interquartile 25% (IQ1) | 2.69 | 3.08 |
| Interquartile 75% (IQ3) | 3.42 | 3.25 |
| Interquartile Range (IQR) | 0.73 | 0.17 |
| Standard Deviation (Sample) | 0.67 | 0.40 |
| Standard Deviation (Population) | 0.66 | 0.39 |
Similar Demographics by Average Family Size
Demographics Similar to Danes by Average Family Size
In terms of average family size, the demographic groups most similar to Danes are Cajun (3.17, a difference of 0.010%), Immigrants from Brazil (3.18, a difference of 0.040%), Immigrants from Belarus (3.17, a difference of 0.040%), Immigrants from Southern Europe (3.18, a difference of 0.070%), and Hungarian (3.18, a difference of 0.080%).
| Demographics | Rating | Rank | Average Family Size |
| Houma | 3.4 /100 | #239 | Tragic 3.18 |
| Osage | 3.2 /100 | #240 | Tragic 3.18 |
| Immigrants | Japan | 3.0 /100 | #241 | Tragic 3.18 |
| Hungarians | 3.0 /100 | #242 | Tragic 3.18 |
| Immigrants | Moldova | 2.9 /100 | #243 | Tragic 3.18 |
| Immigrants | Southern Europe | 2.9 /100 | #244 | Tragic 3.18 |
| Immigrants | Brazil | 2.7 /100 | #245 | Tragic 3.18 |
| Danes | 2.5 /100 | #246 | Tragic 3.17 |
| Cajuns | 2.4 /100 | #247 | Tragic 3.17 |
| Immigrants | Belarus | 2.3 /100 | #248 | Tragic 3.17 |
| Immigrants | Eastern Europe | 2.1 /100 | #249 | Tragic 3.17 |
| Puget Sound Salish | 1.9 /100 | #250 | Tragic 3.17 |
| Immigrants | Spain | 1.8 /100 | #251 | Tragic 3.17 |
| Immigrants | Saudi Arabia | 1.7 /100 | #252 | Tragic 3.17 |
| South Africans | 1.7 /100 | #253 | Tragic 3.17 |
Demographics Similar to Immigrants from Zaire by Average Family Size
In terms of average family size, the demographic groups most similar to Immigrants from Zaire are Burmese (3.22, a difference of 0.010%), Immigrants from Eastern Africa (3.22, a difference of 0.010%), Immigrants from Israel (3.22, a difference of 0.030%), Immigrants from Sudan (3.22, a difference of 0.030%), and Choctaw (3.21, a difference of 0.050%).
| Demographics | Rating | Rank | Average Family Size |
| Immigrants | Eastern Asia | 40.8 /100 | #184 | Average 3.22 |
| Immigrants | Sri Lanka | 39.8 /100 | #185 | Fair 3.22 |
| Immigrants | Argentina | 39.8 /100 | #186 | Fair 3.22 |
| Immigrants | Malaysia | 39.0 /100 | #187 | Fair 3.22 |
| Thais | 38.3 /100 | #188 | Fair 3.22 |
| Pakistanis | 33.7 /100 | #189 | Fair 3.22 |
| Burmese | 31.0 /100 | #190 | Fair 3.22 |
| Immigrants | Zaire | 30.5 /100 | #191 | Fair 3.22 |
| Immigrants | Eastern Africa | 30.1 /100 | #192 | Fair 3.22 |
| Immigrants | Israel | 29.3 /100 | #193 | Fair 3.22 |
| Immigrants | Sudan | 29.1 /100 | #194 | Fair 3.22 |
| Choctaw | 28.3 /100 | #195 | Fair 3.21 |
| Senegalese | 28.2 /100 | #196 | Fair 3.21 |
| Kenyans | 28.0 /100 | #197 | Fair 3.21 |
| Immigrants | Azores | 21.7 /100 | #198 | Fair 3.21 |