Danish vs Immigrants from India Births to Unmarried Women
COMPARE
Danish
Immigrants from India
Births to Unmarried Women
Births to Unmarried Women Comparison
Danes
Immigrants from India
28.7%
BIRTHS TO UNMARRIED WOMEN
98.2/ 100
METRIC RATING
79th/ 347
METRIC RANK
22.9%
BIRTHS TO UNMARRIED WOMEN
100.0/ 100
METRIC RATING
2nd/ 347
METRIC RANK
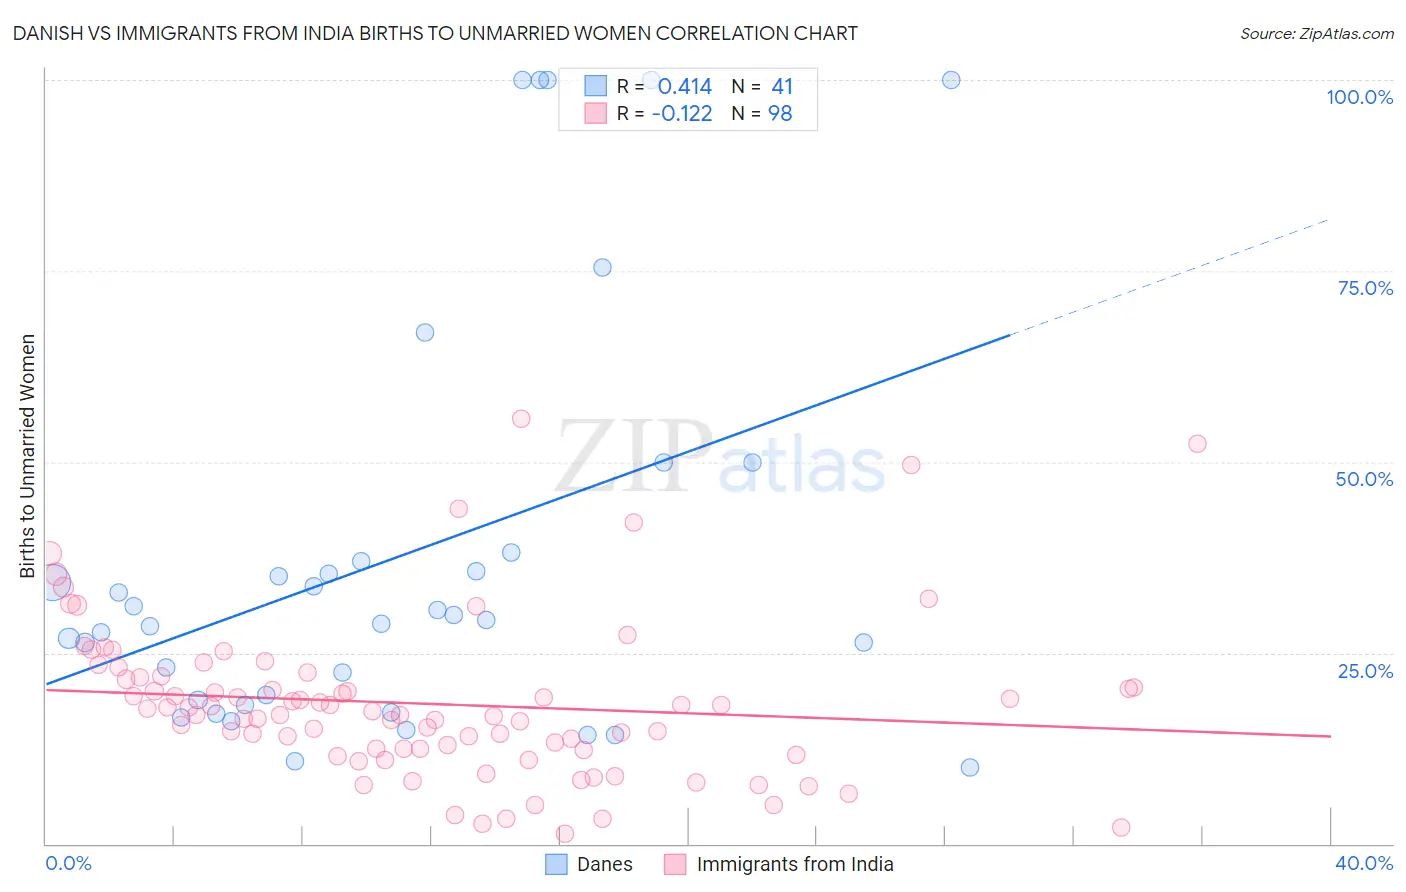
Danish vs Immigrants from India Births to Unmarried Women Correlation Chart
The statistical analysis conducted on geographies consisting of 430,380,429 people shows a moderate positive correlation between the proportion of Danes and percentage of births to unmarried women in the United States with a correlation coefficient (R) of 0.414 and weighted average of 28.7%. Similarly, the statistical analysis conducted on geographies consisting of 401,508,403 people shows a poor negative correlation between the proportion of Immigrants from India and percentage of births to unmarried women in the United States with a correlation coefficient (R) of -0.122 and weighted average of 22.9%, a difference of 25.4%.
Births to Unmarried Women Correlation Summary
| Measurement | Danish | Immigrants from India |
| Minimum | 10.0% | 1.3% |
| Maximum | 100.0% | 55.7% |
| Range | 90.0% | 54.4% |
| Mean | 37.6% | 18.3% |
| Median | 29.3% | 17.1% |
| Interquartile 25% (IQ1) | 18.5% | 12.4% |
| Interquartile 75% (IQ3) | 37.6% | 21.8% |
| Interquartile Range (IQR) | 19.0% | 9.4% |
| Standard Deviation (Sample) | 27.1% | 10.3% |
| Standard Deviation (Population) | 26.7% | 10.3% |
Similar Demographics by Births to Unmarried Women
Demographics Similar to Danes by Births to Unmarried Women
In terms of births to unmarried women, the demographic groups most similar to Danes are Zimbabwean (28.7%, a difference of 0.020%), Immigrants from Afghanistan (28.7%, a difference of 0.020%), Immigrants from Austria (28.7%, a difference of 0.070%), Romanian (28.7%, a difference of 0.18%), and Immigrants from Northern Europe (28.6%, a difference of 0.19%).
| Demographics | Rating | Rank | Births to Unmarried Women |
| Immigrants | Sweden | 98.5 /100 | #72 | Exceptional 28.5% |
| Albanians | 98.5 /100 | #73 | Exceptional 28.5% |
| Immigrants | Bolivia | 98.5 /100 | #74 | Exceptional 28.6% |
| Immigrants | Switzerland | 98.4 /100 | #75 | Exceptional 28.6% |
| Israelis | 98.4 /100 | #76 | Exceptional 28.6% |
| Immigrants | Northern Europe | 98.3 /100 | #77 | Exceptional 28.6% |
| Zimbabweans | 98.2 /100 | #78 | Exceptional 28.7% |
| Danes | 98.2 /100 | #79 | Exceptional 28.7% |
| Immigrants | Afghanistan | 98.1 /100 | #80 | Exceptional 28.7% |
| Immigrants | Austria | 98.1 /100 | #81 | Exceptional 28.7% |
| Romanians | 98.0 /100 | #82 | Exceptional 28.7% |
| Immigrants | Kuwait | 98.0 /100 | #83 | Exceptional 28.8% |
| Immigrants | Poland | 97.6 /100 | #84 | Exceptional 28.9% |
| Sri Lankans | 97.5 /100 | #85 | Exceptional 28.9% |
| Immigrants | Jordan | 97.4 /100 | #86 | Exceptional 29.0% |
Demographics Similar to Immigrants from India by Births to Unmarried Women
In terms of births to unmarried women, the demographic groups most similar to Immigrants from India are Filipino (23.0%, a difference of 0.38%), Immigrants from Taiwan (23.0%, a difference of 0.52%), Immigrants from Hong Kong (23.6%, a difference of 3.0%), Assyrian/Chaldean/Syriac (22.0%, a difference of 4.2%), and Immigrants from Iran (24.0%, a difference of 4.6%).
| Demographics | Rating | Rank | Births to Unmarried Women |
| Assyrians/Chaldeans/Syriacs | 100.0 /100 | #1 | Exceptional 22.0% |
| Immigrants | India | 100.0 /100 | #2 | Exceptional 22.9% |
| Filipinos | 100.0 /100 | #3 | Exceptional 23.0% |
| Immigrants | Taiwan | 100.0 /100 | #4 | Exceptional 23.0% |
| Immigrants | Hong Kong | 100.0 /100 | #5 | Exceptional 23.6% |
| Immigrants | Iran | 100.0 /100 | #6 | Exceptional 24.0% |
| Thais | 100.0 /100 | #7 | Exceptional 24.0% |
| Immigrants | China | 100.0 /100 | #8 | Exceptional 24.7% |
| Immigrants | South Central Asia | 100.0 /100 | #9 | Exceptional 24.7% |
| Immigrants | Eastern Asia | 100.0 /100 | #10 | Exceptional 25.0% |
| Immigrants | Israel | 100.0 /100 | #11 | Exceptional 25.1% |
| Indians (Asian) | 100.0 /100 | #12 | Exceptional 25.3% |
| Iranians | 100.0 /100 | #13 | Exceptional 25.3% |
| Immigrants | Lebanon | 100.0 /100 | #14 | Exceptional 25.3% |
| Immigrants | Singapore | 100.0 /100 | #15 | Exceptional 25.6% |