Danish vs Egyptian Single Mother Households

COMPARE

Danish
Race
Ancestry
AfghanAfricanAlaska NativeAlaskan AthabascanAlbanianAleutAlsatianAmericanApacheArabArapahoArgentineanArmenianAssyrian/Chaldean/SyriacAustralianAustrianBahamianBangladeshiBarbadianBasqueBelgianBelizeanBermudanBhutaneseBlackfeetBolivianBrazilianBritishBritish West IndianBulgarianBurmeseCajunCambodianCanadianCape VerdeanCarpatho RusynCelticCentral AmericanCentral American IndianCherokeeCheyenneChickasawChileanChineseChippewaChoctawColombianColvilleComancheCosta RicanCreeCreekCroatianCrowCubanCypriotCzechCzechoslovakianDanishDelawareDominicanDutchDutch West IndianEastern EuropeanEcuadorianEnglishEstonianEthiopianEuropeanFijianFilipinoFinnishFrenchFrench American IndianFrench CanadianGermanGerman RussianGhanaianGreekGuamanian/ChamorroGuatemalanGuyaneseHaitianHmongHonduranHopiHoumaHungarianIcelanderIndian (Asian)IndonesianInupiatIranianIraqiIrishIroquoisIsraeliItalianJamaicanJapaneseJordanianKenyanKiowaKoreanLaotianLatvianLebaneseLiberianLithuanianLumbeeLuxembourgerMacedonianMalaysianMalteseMarshalleseMenomineeMexicanMexican American IndianMongolianMoroccanNative HawaiianNavajoNepaleseNew ZealanderNicaraguanNigerianNorthern EuropeanNorwegianOkinawanOsageOttawaPaiutePakistaniPalestinianPanamanianParaguayanPennsylvania GermanPeruvianPimaPolishPortuguesePotawatomiPuebloPuerto RicanPuget Sound SalishRomanianRussianSalvadoranSamoanScandinavianScotch-IrishScottishSeminoleSenegaleseSerbianShoshoneSierra LeoneanSiouxSlavicSlovakSloveneSomaliSouth AfricanSouth AmericanSouth American IndianSoviet UnionSpaniardSpanishSpanish AmericanSpanish American IndianSri LankanSubsaharan AfricanSudaneseSwedishSwissSyrianTaiwaneseThaiTlingit-HaidaTohono O'OdhamTonganTrinidadian and TobagonianTsimshianTurkishU.S. Virgin IslanderUgandanUkrainianUruguayanUteVenezuelanVietnameseWelshWest IndianYakamaYaquiYugoslavianYumanYup'ikZimbabwean
Immigration
NonimmigrantsImmigrantsAfghanistanAfricaAlbaniaArgentinaArmeniaAsiaAustraliaAustriaBahamasBangladeshBarbadosBelarusBelgiumBelizeBoliviaBosnia and HerzegovinaBrazilBulgariaBurma/MyanmarCabo VerdeCambodiaCameroonCanadaCaribbeanCentral AmericaChileChinaColombiaCongoCosta RicaCroatiaCubaCzechoslovakiaDenmarkDominicaDominican RepublicEastern AfricaEastern AsiaEastern EuropeEcuadorEgyptEl SalvadorEnglandEritreaEthiopiaEuropeFijiFranceGermanyGhanaGreeceGrenadaGuatemalaGuyanaHaitiHondurasHong KongHungaryIndiaIndonesiaIranIraqIrelandIsraelItalyJamaicaJapanJordanKazakhstanKenyaKoreaKuwaitLaosLatin AmericaLatviaLebanonLiberiaLithuaniaMalaysiaMexicoMicronesiaMiddle AfricaMoldovaMoroccoNepalNetherlandsNicaraguaNigeriaNorth AmericaNorth MacedoniaNorthern AfricaNorthern EuropeNorwayOceaniaPakistanPanamaPeruPhilippinesPolandPortugalRomaniaRussiaSaudi ArabiaScotlandSenegalSerbiaSierra LeoneSingaporeSomaliaSouth AfricaSouth AmericaSouth Central AsiaSouth Eastern AsiaSouthern EuropeSpainSri LankaSt. Vincent and the GrenadinesSudanSwedenSwitzerlandSyriaTaiwanThailandTrinidad and TobagoTurkeyUgandaUkraineUruguayUzbekistanVenezuelaVietnamWest IndiesWestern AfricaWestern AsiaWestern EuropeYemenZaireZimbabweAzores
Egyptian
Race
Ancestry
AfghanAfricanAlaska NativeAlaskan AthabascanAlbanianAleutAlsatianAmericanApacheArabArapahoArgentineanArmenianAssyrian/Chaldean/SyriacAustralianAustrianBahamianBangladeshiBarbadianBasqueBelgianBelizeanBermudanBhutaneseBlackfeetBolivianBrazilianBritishBritish West IndianBulgarianBurmeseCajunCambodianCanadianCape VerdeanCarpatho RusynCelticCentral AmericanCentral American IndianCherokeeCheyenneChickasawChileanChineseChippewaChoctawColombianColvilleComancheCosta RicanCreeCreekCroatianCrowCubanCypriotCzechCzechoslovakianDelawareDominicanDutchDutch West IndianEastern EuropeanEcuadorianEgyptianEnglishEstonianEthiopianEuropeanFijianFilipinoFinnishFrenchFrench American IndianFrench CanadianGermanGerman RussianGhanaianGreekGuamanian/ChamorroGuatemalanGuyaneseHaitianHmongHonduranHopiHoumaHungarianIcelanderIndian (Asian)IndonesianInupiatIranianIraqiIrishIroquoisIsraeliItalianJamaicanJapaneseJordanianKenyanKiowaKoreanLaotianLatvianLebaneseLiberianLithuanianLumbeeLuxembourgerMacedonianMalaysianMalteseMarshalleseMenomineeMexicanMexican American IndianMongolianMoroccanNative HawaiianNavajoNepaleseNew ZealanderNicaraguanNigerianNorthern EuropeanNorwegianOkinawanOsageOttawaPaiutePakistaniPalestinianPanamanianParaguayanPennsylvania GermanPeruvianPimaPolishPortuguesePotawatomiPuebloPuerto RicanPuget Sound SalishRomanianRussianSalvadoranSamoanScandinavianScotch-IrishScottishSeminoleSenegaleseSerbianShoshoneSierra LeoneanSiouxSlavicSlovakSloveneSomaliSouth AfricanSouth AmericanSouth American IndianSoviet UnionSpaniardSpanishSpanish AmericanSpanish American IndianSri LankanSubsaharan AfricanSudaneseSwedishSwissSyrianTaiwaneseThaiTlingit-HaidaTohono O'OdhamTonganTrinidadian and TobagonianTsimshianTurkishU.S. Virgin IslanderUgandanUkrainianUruguayanUteVenezuelanVietnameseWelshWest IndianYakamaYaquiYugoslavianYumanYup'ikZimbabwean
Immigration
NonimmigrantsImmigrantsAfghanistanAfricaAlbaniaArgentinaArmeniaAsiaAustraliaAustriaBahamasBangladeshBarbadosBelarusBelgiumBelizeBoliviaBosnia and HerzegovinaBrazilBulgariaBurma/MyanmarCabo VerdeCambodiaCameroonCanadaCaribbeanCentral AmericaChileChinaColombiaCongoCosta RicaCroatiaCubaCzechoslovakiaDenmarkDominicaDominican RepublicEastern AfricaEastern AsiaEastern EuropeEcuadorEgyptEl SalvadorEnglandEritreaEthiopiaEuropeFijiFranceGermanyGhanaGreeceGrenadaGuatemalaGuyanaHaitiHondurasHong KongHungaryIndiaIndonesiaIranIraqIrelandIsraelItalyJamaicaJapanJordanKazakhstanKenyaKoreaKuwaitLaosLatin AmericaLatviaLebanonLiberiaLithuaniaMalaysiaMexicoMicronesiaMiddle AfricaMoldovaMoroccoNepalNetherlandsNicaraguaNigeriaNorth AmericaNorth MacedoniaNorthern AfricaNorthern EuropeNorwayOceaniaPakistanPanamaPeruPhilippinesPolandPortugalRomaniaRussiaSaudi ArabiaScotlandSenegalSerbiaSierra LeoneSingaporeSomaliaSouth AfricaSouth AmericaSouth Central AsiaSouth Eastern AsiaSouthern EuropeSpainSri LankaSt. Vincent and the GrenadinesSudanSwedenSwitzerlandSyriaTaiwanThailandTrinidad and TobagoTurkeyUgandaUkraineUruguayUzbekistanVenezuelaVietnamWest IndiesWestern AfricaWestern AsiaWestern EuropeYemenZaireZimbabweAzores
Single Mother Households
Income
Poverty
Unemployment
Labor Participation
Family Structure
Vehicle Availability
Education Level
Disability

Single Mother Households Comparison

Danes

Egyptians

Exceptional
Exceptional
5.5%
SINGLE MOTHER HOUSEHOLDS
98.9/ 100
METRIC RATING
58th/ 347
METRIC RANK
5.9%
SINGLE MOTHER HOUSEHOLDS
90.7/ 100
METRIC RATING
133rd/ 347
METRIC RANK

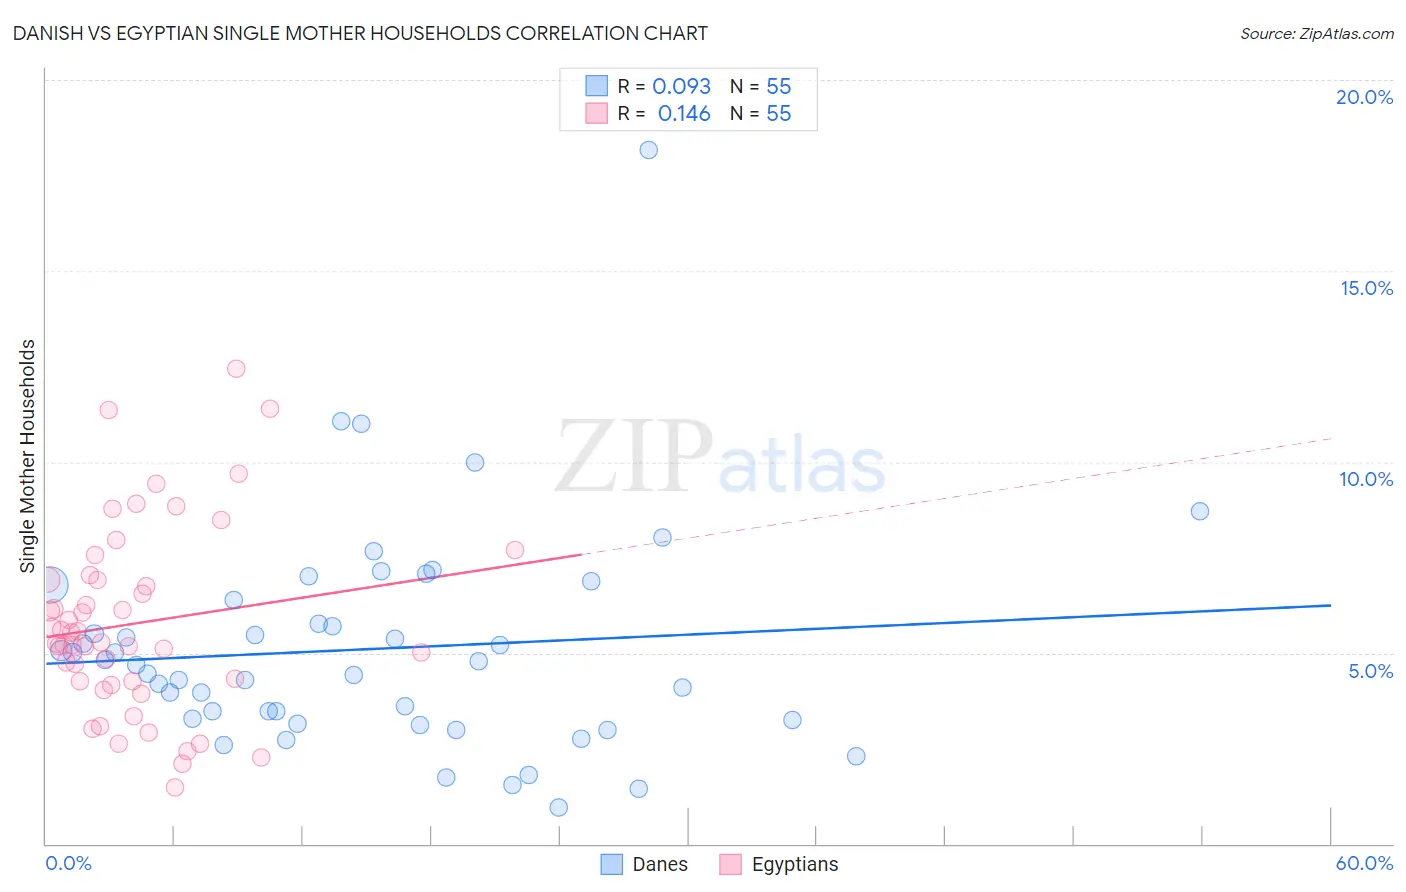
Danish vs Egyptian Single Mother Households Correlation Chart

The statistical analysis conducted on geographies consisting of 471,565,443 people shows a slight positive correlation between the proportion of Danes and percentage of single mother households in the United States with a correlation coefficient (R) of 0.093 and weighted average of 5.5%. Similarly, the statistical analysis conducted on geographies consisting of 276,342,561 people shows a poor positive correlation between the proportion of Egyptians and percentage of single mother households in the United States with a correlation coefficient (R) of 0.146 and weighted average of 5.9%, a difference of 7.0%.
Danish vs Egyptian Single Mother Households

Single Mother Households Correlation Summary

MeasurementDanishEgyptian
Minimum0.95%1.5%
Maximum18.2%12.4%
Range17.2%11.0%
Mean5.1%5.8%
Median4.7%5.3%
Interquartile 25% (IQ1)3.2%4.2%
Interquartile 75% (IQ3)6.4%6.9%
Interquartile Range (IQR)3.1%2.7%
Standard Deviation (Sample)2.9%2.4%
Standard Deviation (Population)2.9%2.4%

Similar Demographics by Single Mother Households

Demographics Similar to Danes by Single Mother Households

In terms of single mother households, the demographic groups most similar to Danes are Immigrants from Europe (5.5%, a difference of 0.24%), Immigrants from Romania (5.5%, a difference of 0.32%), Immigrants from Denmark (5.5%, a difference of 0.39%), Luxembourger (5.6%, a difference of 0.51%), and Immigrants from Lebanon (5.5%, a difference of 0.56%).
DemographicsRating | RankSingle Mother Households
Immigrants | Belarus
99.2
/100
|
#51
Exceptional
5.5%
Swedes
99.1
/100
|
#52
Exceptional
5.5%
Immigrants | Russia
99.1
/100
|
#53
Exceptional
5.5%
Immigrants | Lebanon
99.1
/100
|
#54
Exceptional
5.5%
Immigrants | Denmark
99.1
/100
|
#55
Exceptional
5.5%
Immigrants | Romania
99.0
/100
|
#56
Exceptional
5.5%
Immigrants | Europe
99.0
/100
|
#57
Exceptional
5.5%
Danes
98.9
/100
|
#58
Exceptional
5.5%
Luxembourgers
98.7
/100
|
#59
Exceptional
5.6%
Immigrants | Norway
98.7
/100
|
#60
Exceptional
5.6%
Australians
98.7
/100
|
#61
Exceptional
5.6%
Poles
98.6
/100
|
#62
Exceptional
5.6%
Immigrants | North Macedonia
98.6
/100
|
#63
Exceptional
5.6%
Immigrants | France
98.6
/100
|
#64
Exceptional
5.6%
Greeks
98.6
/100
|
#65
Exceptional
5.6%

Demographics Similar to Egyptians by Single Mother Households

In terms of single mother households, the demographic groups most similar to Egyptians are Canadian (5.9%, a difference of 0.060%), Albanian (5.9%, a difference of 0.15%), Immigrants from Saudi Arabia (5.9%, a difference of 0.15%), Immigrants from Spain (5.9%, a difference of 0.20%), and Palestinian (5.9%, a difference of 0.55%).
DemographicsRating | RankSingle Mother Households
Welsh
92.8
/100
|
#126
Exceptional
5.9%
Lebanese
92.4
/100
|
#127
Exceptional
5.9%
Czechoslovakians
92.2
/100
|
#128
Exceptional
5.9%
Immigrants | Bolivia
92.2
/100
|
#129
Exceptional
5.9%
Palestinians
92.1
/100
|
#130
Exceptional
5.9%
Immigrants | Spain
91.2
/100
|
#131
Exceptional
5.9%
Albanians
91.1
/100
|
#132
Exceptional
5.9%
Egyptians
90.7
/100
|
#133
Exceptional
5.9%
Canadians
90.5
/100
|
#134
Exceptional
5.9%
Immigrants | Saudi Arabia
90.2
/100
|
#135
Exceptional
5.9%
Jordanians
88.9
/100
|
#136
Excellent
6.0%
Immigrants | Pakistan
88.4
/100
|
#137
Excellent
6.0%
Icelanders
86.9
/100
|
#138
Excellent
6.0%
Syrians
86.0
/100
|
#139
Excellent
6.0%
French
85.7
/100
|
#140
Excellent
6.0%