Croatian vs Palestinian Single Mother Households
COMPARE
Croatian
Palestinian
Single Mother Households
Single Mother Households Comparison
Croatians
Palestinians
5.5%
SINGLE MOTHER HOUSEHOLDS
99.3/ 100
METRIC RATING
46th/ 347
METRIC RANK
5.9%
SINGLE MOTHER HOUSEHOLDS
92.1/ 100
METRIC RATING
130th/ 347
METRIC RANK
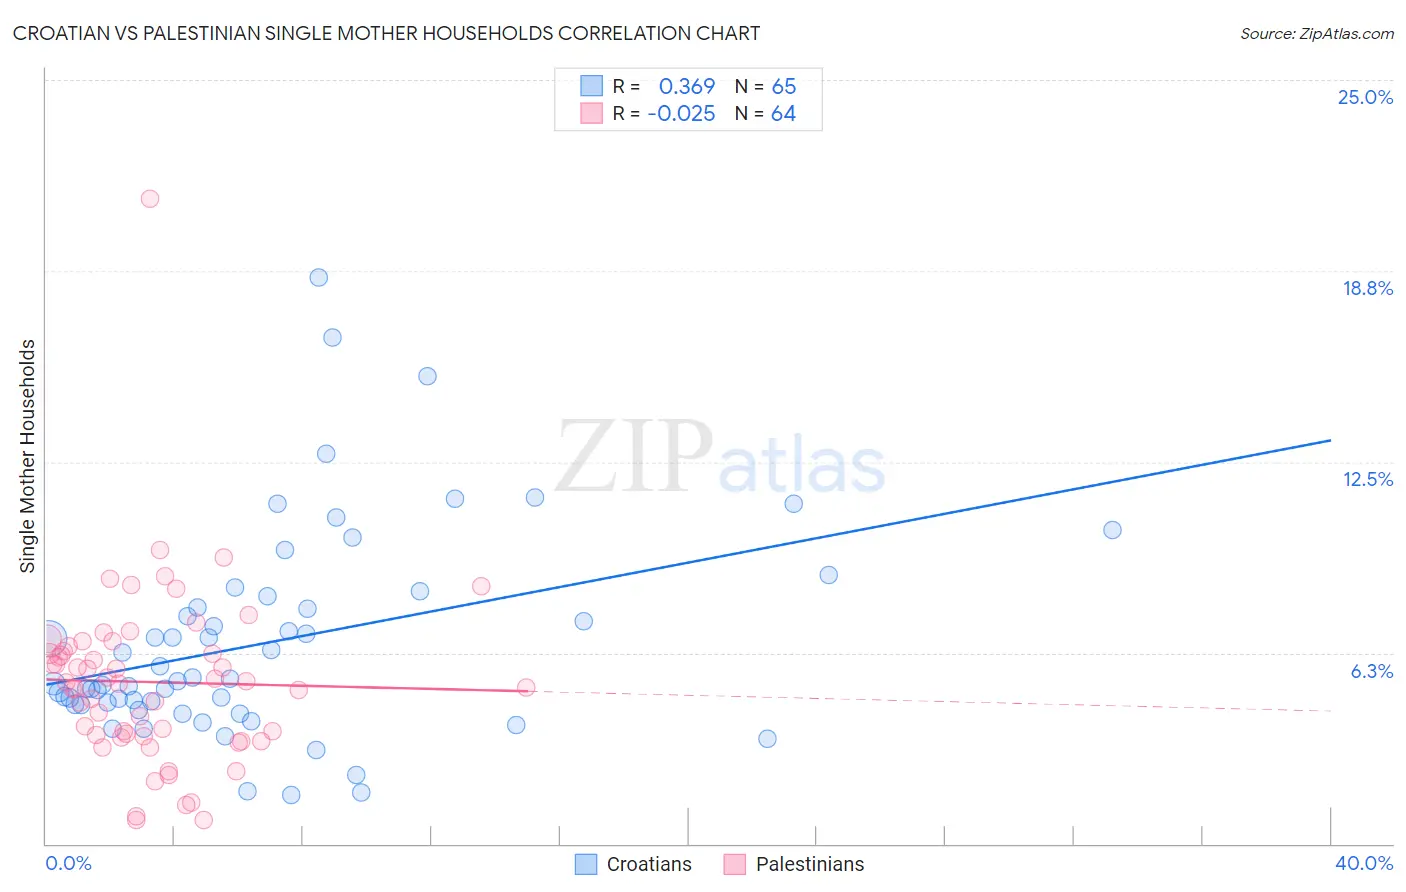
Croatian vs Palestinian Single Mother Households Correlation Chart
The statistical analysis conducted on geographies consisting of 374,465,881 people shows a mild positive correlation between the proportion of Croatians and percentage of single mother households in the United States with a correlation coefficient (R) of 0.369 and weighted average of 5.5%. Similarly, the statistical analysis conducted on geographies consisting of 216,255,094 people shows no correlation between the proportion of Palestinians and percentage of single mother households in the United States with a correlation coefficient (R) of -0.025 and weighted average of 5.9%, a difference of 7.9%.
Single Mother Households Correlation Summary
| Measurement | Croatian | Palestinian |
| Minimum | 1.6% | 0.78% |
| Maximum | 18.5% | 21.1% |
| Range | 16.9% | 20.3% |
| Mean | 6.6% | 5.3% |
| Median | 5.3% | 5.3% |
| Interquartile 25% (IQ1) | 4.6% | 3.5% |
| Interquartile 75% (IQ3) | 7.9% | 6.4% |
| Interquartile Range (IQR) | 3.4% | 2.8% |
| Standard Deviation (Sample) | 3.4% | 2.9% |
| Standard Deviation (Population) | 3.4% | 2.9% |
Similar Demographics by Single Mother Households
Demographics Similar to Croatians by Single Mother Households
In terms of single mother households, the demographic groups most similar to Croatians are Norwegian (5.5%, a difference of 0.18%), Immigrants from Croatia (5.4%, a difference of 0.26%), Lithuanian (5.4%, a difference of 0.38%), Turkish (5.5%, a difference of 0.38%), and Immigrants from Latvia (5.5%, a difference of 0.41%).
| Demographics | Rating | Rank | Single Mother Households |
| Immigrants | Sweden | 99.6 /100 | #39 | Exceptional 5.4% |
| Estonians | 99.6 /100 | #40 | Exceptional 5.4% |
| Immigrants | Greece | 99.5 /100 | #41 | Exceptional 5.4% |
| Macedonians | 99.5 /100 | #42 | Exceptional 5.4% |
| Immigrants | South Central Asia | 99.5 /100 | #43 | Exceptional 5.4% |
| Lithuanians | 99.4 /100 | #44 | Exceptional 5.4% |
| Immigrants | Croatia | 99.4 /100 | #45 | Exceptional 5.4% |
| Croatians | 99.3 /100 | #46 | Exceptional 5.5% |
| Norwegians | 99.3 /100 | #47 | Exceptional 5.5% |
| Turks | 99.2 /100 | #48 | Exceptional 5.5% |
| Immigrants | Latvia | 99.2 /100 | #49 | Exceptional 5.5% |
| Immigrants | Scotland | 99.2 /100 | #50 | Exceptional 5.5% |
| Immigrants | Belarus | 99.2 /100 | #51 | Exceptional 5.5% |
| Swedes | 99.1 /100 | #52 | Exceptional 5.5% |
| Immigrants | Russia | 99.1 /100 | #53 | Exceptional 5.5% |
Demographics Similar to Palestinians by Single Mother Households
In terms of single mother households, the demographic groups most similar to Palestinians are Immigrants from Bolivia (5.9%, a difference of 0.030%), Czechoslovakian (5.9%, a difference of 0.040%), Lebanese (5.9%, a difference of 0.12%), Welsh (5.9%, a difference of 0.30%), and Slavic (5.9%, a difference of 0.33%).
| Demographics | Rating | Rank | Single Mother Households |
| Immigrants | Uzbekistan | 93.4 /100 | #123 | Exceptional 5.9% |
| Immigrants | Argentina | 93.2 /100 | #124 | Exceptional 5.9% |
| Slavs | 92.9 /100 | #125 | Exceptional 5.9% |
| Welsh | 92.8 /100 | #126 | Exceptional 5.9% |
| Lebanese | 92.4 /100 | #127 | Exceptional 5.9% |
| Czechoslovakians | 92.2 /100 | #128 | Exceptional 5.9% |
| Immigrants | Bolivia | 92.2 /100 | #129 | Exceptional 5.9% |
| Palestinians | 92.1 /100 | #130 | Exceptional 5.9% |
| Immigrants | Spain | 91.2 /100 | #131 | Exceptional 5.9% |
| Albanians | 91.1 /100 | #132 | Exceptional 5.9% |
| Egyptians | 90.7 /100 | #133 | Exceptional 5.9% |
| Canadians | 90.5 /100 | #134 | Exceptional 5.9% |
| Immigrants | Saudi Arabia | 90.2 /100 | #135 | Exceptional 5.9% |
| Jordanians | 88.9 /100 | #136 | Excellent 6.0% |
| Immigrants | Pakistan | 88.4 /100 | #137 | Excellent 6.0% |